Plot
? |
Symb
? |
Source
* |
Average ? |
Thresholds ? |
N_
data |
QC1
parameter |
Data
downloads |
Remarks |
| method |
value |
unit |
method |
value |
| 1 |
• | QC1DB |
none |
|
NONE |
VAL | -0,100 |
0 |
frames_percent_snrgt2 |
this |
last_yr |
all
|
Low_JHK |
| 1 |
o | QC1DB |
none |
|
NONE |
VAL | -0,100 |
0 |
frames_percent_snrgt2 |
this |
last_yr |
all
|
Low_JHK_(science) |
| 2 |
• | QC1DB |
none |
|
NONE |
VAL | -0,100 |
14 |
frames_percent_snrgt2 |
this |
last_yr |
all
|
Medium_K_2.1 |
| 2 |
o | QC1DB |
none |
|
NONE |
VAL | -0,100 |
33 |
frames_percent_snrgt2 |
this |
last_yr |
all
|
Medium_K_2.1_(science) |
| 3 |
• | QC1DB |
none |
|
NONE |
VAL | -0,100 |
13 |
frames_percent_snrgt2 |
this |
last_yr |
all
|
Medium_K_2.3 |
| 3 |
o | QC1DB |
none |
|
NONE |
VAL | -0,100 |
9 |
frames_percent_snrgt2 |
this |
last_yr |
all
|
Medium_K_2.3_(science) |
| 4 |
• | QC1DB |
none |
|
NONE |
VAL | 0,100 |
16 |
frames_percent_snrgt2 |
this |
last_yr |
all
|
High_K_2.172 |
| 4 |
o | QC1DB |
none |
|
NONE |
VAL | 0,100 |
12 |
frames_percent_snrgt2 |
this |
last_yr |
all
|
High_K_2.172_(science) |
| 5 |
• | QC1DB |
none |
|
NONE |
VAL | 0,100 |
29 |
frames_percent_snrgt2 |
this |
last_yr |
all
|
SM_Low_JHK |
| 5 |
o | QC1DB |
none |
|
NONE |
VAL | 0,100 |
19 |
frames_percent_snrgt2 |
this |
last_yr |
all
|
SM_Low_JHK_(science) |
| 6 |
• | QC1DB |
none |
|
NONE |
VAL | 0,100 |
4 |
frames_percent_snrgt2 |
this |
last_yr |
all
|
SM_Medium_K_2.1 |
| 6 |
o | QC1DB |
none |
|
NONE |
VAL | 0,100 |
2 |
frames_percent_snrgt2 |
this |
last_yr |
all
|
SM_Medium_K_2.1_(science) |
| 7 |
• | QC1DB |
none |
|
NONE |
VAL | 0,100 |
4 |
frames_percent_snrgt2 |
this |
last_yr |
all
|
SM_Medium_K_2.3 |
| 7 |
o | QC1DB |
none |
|
NONE |
VAL | 0,100 |
2 |
frames_percent_snrgt2 |
this |
last_yr |
all
|
SM_Medium_K_2.3_(science) |
| 8 |
• | QC1DB |
none |
|
NONE |
VAL | 0,100 |
16 |
frames_percent_snrgt2 |
this |
last_yr |
all
|
SM_High_K_2.172 |
| 8 |
o | QC1DB |
none |
|
NONE |
VAL | 0,100 |
12 |
frames_percent_snrgt2 |
this |
last_yr |
all
|
SM_High_K_2.172_(science) |
| |
|
*Data sources: QC1DB: QC1 database; LOCAL: local text file
|
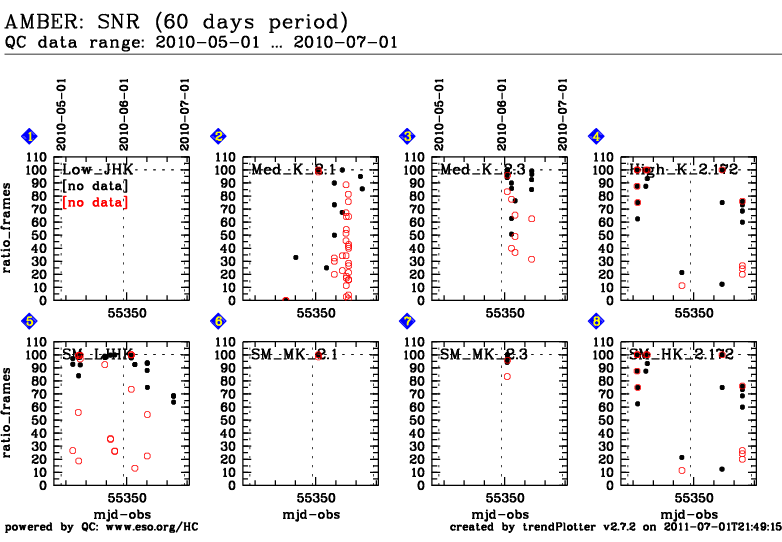
| Plot 1 | | data source: | amber_calibrators_K
(QC1 database) |
parameter | dataset:
(numbers applicable to • ) | frames_percent_snrgt2 | • |
| average: | none |
| fixed thresholds: | 0.0...100.0 | NONE |
| N_data: | 0 |
| [click on plot for closeup] |

| Plot 2 | | data source: | amber_calibrators_K
(QC1 database) |
parameter | dataset:
(numbers applicable to • ) | frames_percent_snrgt2 | • |
| average: | none |
| fixed thresholds: | 0.0...100.0 | NONE |
| N_data: | 14 |
| [click on plot for closeup] |

| Plot 3 | | data source: | amber_calibrators_K
(QC1 database) |
parameter | dataset:
(numbers applicable to • ) | frames_percent_snrgt2 | • |
| average: | none |
| fixed thresholds: | 0.0...100.0 | NONE |
| N_data: | 13 |
| [click on plot for closeup] |

| Plot 4 | | data source: | amber_calibrators_K
(QC1 database) |
parameter | dataset:
(numbers applicable to • ) | frames_percent_snrgt2 | • |
| average: | none |
| fixed thresholds: | 0.0...100.0 | NONE |
| N_data: | 16 |
| [click on plot for closeup] |

| Plot 5 | | data source: | amber_calibrators_K
(QC1 database) |
parameter | dataset:
(numbers applicable to • ) | frames_percent_snrgt2 | • |
| average: | none |
| fixed thresholds: | 0.0...100.0 | NONE |
| N_data: | 29 |
| [click on plot for closeup] |

| Plot 6 | | data source: | amber_calibrators_K
(QC1 database) |
parameter | dataset:
(numbers applicable to • ) | frames_percent_snrgt2 | • |
| average: | none |
| fixed thresholds: | 0.0...100.0 | NONE |
| N_data: | 4 |
| [click on plot for closeup] |

| Plot 7 | | data source: | amber_calibrators_K
(QC1 database) |
parameter | dataset:
(numbers applicable to • ) | frames_percent_snrgt2 | • |
| average: | none |
| fixed thresholds: | 0.0...100.0 | NONE |
| N_data: | 4 |
| [click on plot for closeup] |

| Plot 8 | | data source: | amber_calibrators_K
(QC1 database) |
parameter | dataset:
(numbers applicable to • ) | frames_percent_snrgt2 | • |
| average: | none |
| fixed thresholds: | 0.0...100.0 | NONE |
| N_data: | 16 |
| [click on plot for closeup] |

Click on any of the plots to see a close-up version.
The latest date is indicated on top of the plot, data points belonging to that date are specially marked.
If configured,
- statistical averages are indicated by a solid line, and thresholds by broken lines
- outliers are marked by a red asterisk. They are defined as data points outside the
threshold lines
- "aliens" (= data points outside the plot Y limits) are marked by a red arrow (↑ or ↓)
- you can download the data for each parameter set if the 'Data downloads' link shows up
|
