Plot
? |
Symb
? |
Source
* |
OPS?
** |
Average ? |
Thresholds ? |
N_
data |
QC1
parameter |
Data
downloads |
Remarks |
| method |
value |
unit |
method |
value |
| 1 |
* | QC1DB |
no |
none |
|
NONE |
VAL | 0,300 |
13 |
bad_pixels |
|
numb_Bad_Pixels |
| 2 |
* | QC1DB |
no |
none |
|
NONE |
VAL | 0,.11 |
13 |
bad_pixels_ratio |
|
|
| |
|
*Data sources: QC1DB: QC1 database; LOCAL: local text file | **OPS: to indicate that OPSLOG data are included
|
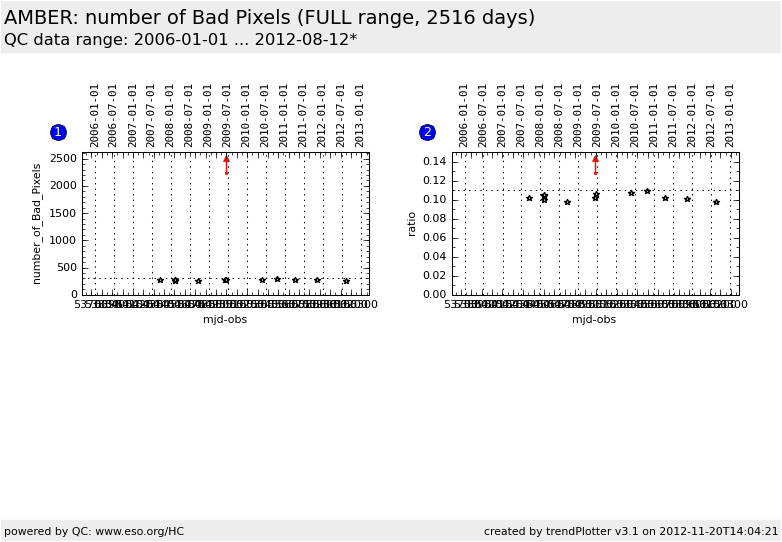
Plot 1
scores: not implemented
| | data source: | amber_detector
(QC1 database) |
| dataset: | bad_pixels | * |
| average: | none |
| fixed thresholds: | 0...300 | NONE |
| N_data plotted: | 13 |
| [click on plot for closeup] |
Plot 2
scores: not implemented
| | data source: | amber_detector
(QC1 database) |
| dataset: | bad_pixels_ratio | * |
| average: | none |
| fixed thresholds: | 0...0.11 | NONE |
| N_data plotted: | 13 |
| [click on plot for closeup] |
The number of Bad Pixels is monitored and is extracted from the calibration darks and Flat Field.
The AMBER detector is 512x512, the scale of the left plot is 3.5% of the detector
These data are taken once a period in average.
General information
Click on any of the plots to see a close-up version.
The latest date is indicated on top of the plot, data points belonging to that date are specially marked.
If configured,
- statistical averages are indicated by a solid line, and thresholds by broken lines
- outliers are marked by a red asterisk. They are defined as data points outside the
threshold lines
- "aliens" (= data points outside the plot Y limits) are marked by a red arrow (↑ or ↓)
- you can download the data for each parameter set if the 'Data downloads' link shows up
|
