Plot
? |
Symb
? |
Source
* |
Average ? |
Thresholds ? |
N_
data |
QC1
parameter |
Data
downloads |
Remarks |
| method |
value |
unit |
method |
value |
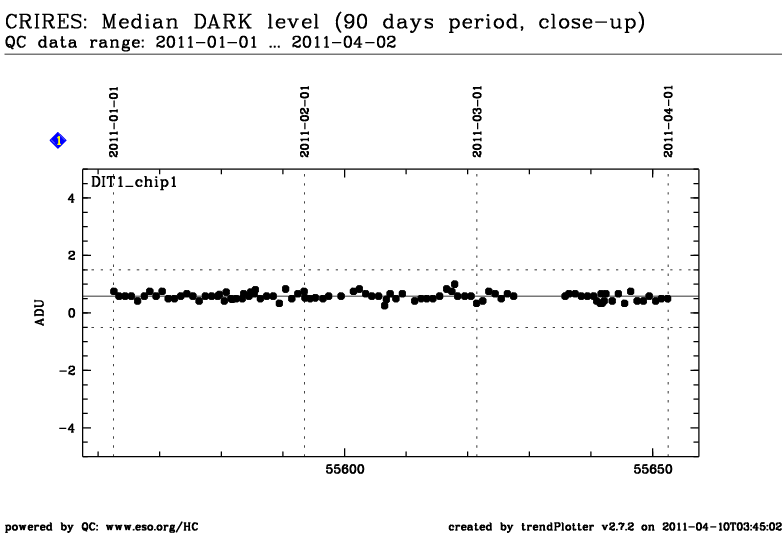
| 1 |
• | QC1DB |
MEDIAN |
0.58333 |
ADU |
VAL | -0.5,1.5 |
94 |
darkmed |
this |
last_yr |
all
|
median dark level, chip 1, DIT=1 |
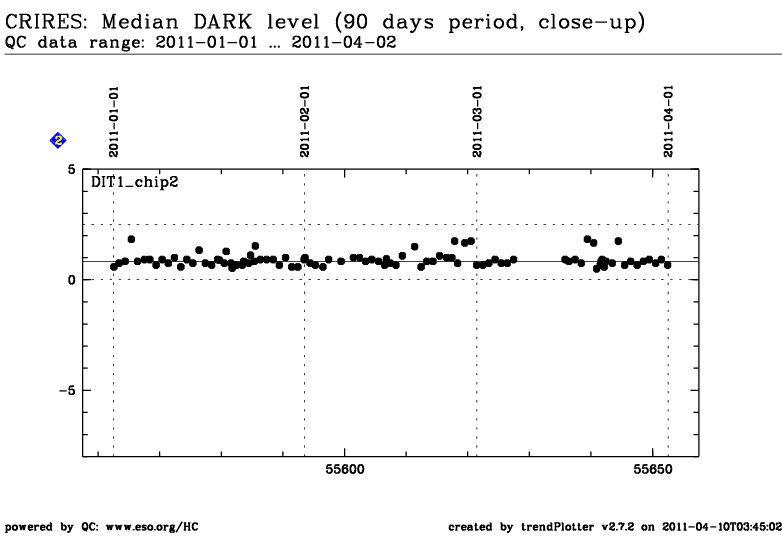
| 2 |
• | QC1DB |
MEDIAN |
0.83333 |
ADU |
VAL | 0,2.5 |
94 |
darkmed |
this |
last_yr |
all
|
median dark level, chip 2, DIT=1 |
| 3 |
• | QC1DB |
MEDIAN |
0.58333 |
ADU |
VAL | -0.5,2.0 |
94 |
darkmed |
this |
last_yr |
all
|
median dark level, chip 3, DIT=1 |
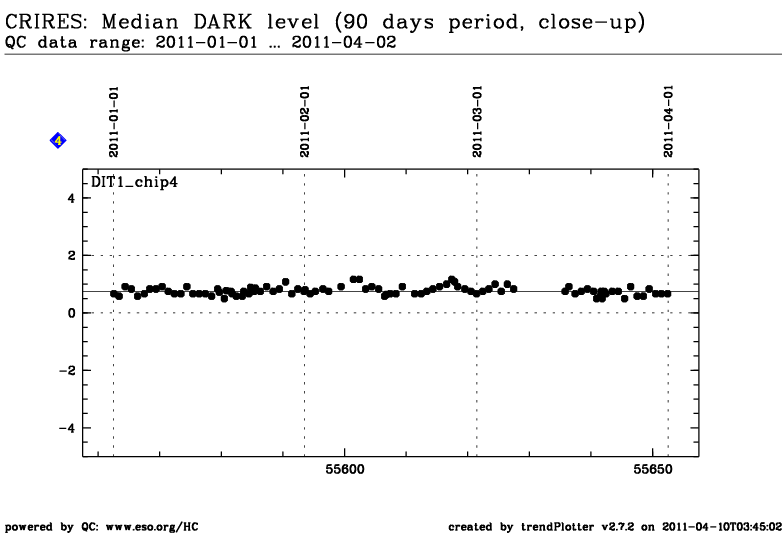
| 4 |
• | QC1DB |
MEDIAN |
0.75 |
ADU |
VAL | 0,2.0 |
94 |
darkmed |
this |
last_yr |
all
|
median dark level, chip 4, DIT=1 |
| 5 |
• | QC1DB |
MEDIAN |
10.29798 |
ADU |
VAL | 0,20 |
106 |
darkmed |
this |
last_yr |
all
|
median dark level, chip 1, DIT=300 |
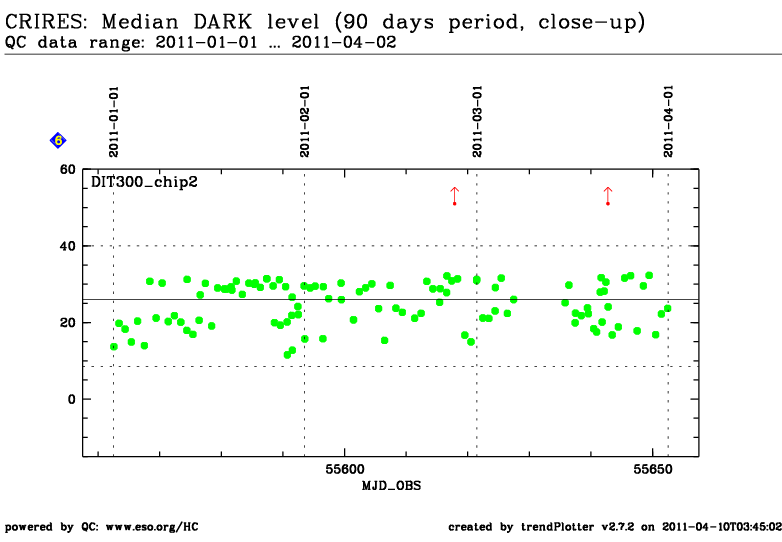
| 6 |
• | QC1DB |
MEDIAN |
25.98232 |
ADU |
VAL | 8.5,40 |
110 |
darkmed |
this |
last_yr |
all
|
median dark level, chip 2, DIT=300 |
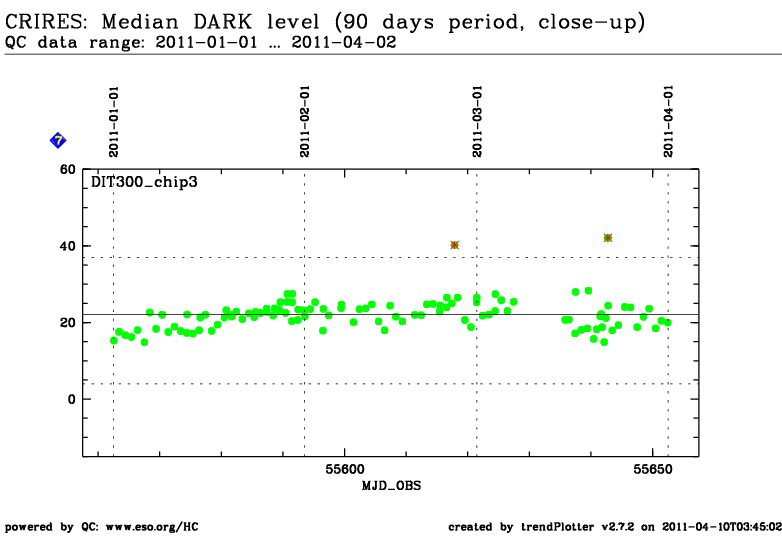
| 7 |
• | QC1DB |
MEDIAN |
22.00758 |
ADU |
VAL | 4,37 |
110 |
darkmed |
this |
last_yr |
all
|
median dark level, chip 3, DIT=300 |
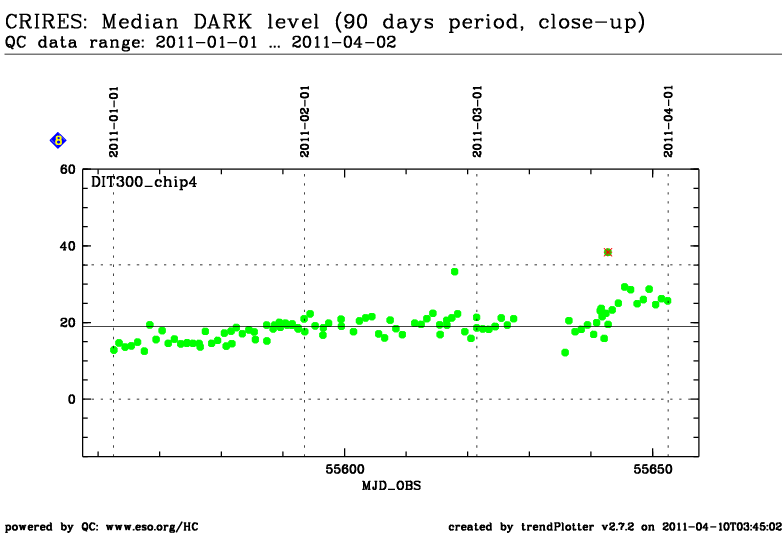
| 8 |
• | QC1DB |
MEDIAN |
18.93182 |
ADU |
VAL | 0,35 |
105 |
darkmed |
this |
last_yr |
all
|
median dark level, chip 4, DIT=300 |
| |
|
*Data sources: QC1DB: QC1 database; LOCAL: local text file
|
| Plot 1 | | data source: | crires_dark
(QC1 database) |
| parameter | dataset: | darkmed | • |
| median: | 0.58333 | ADU |
| fixed thresholds: | -0.5...1.5 | ADU |
| N_data: | 94 |
| [click on plot for closeup] |
| Plot 2 | | data source: | crires_dark
(QC1 database) |
| parameter | dataset: | darkmed | • |
| median: | 0.83333 | ADU |
| fixed thresholds: | 0.0...2.5 | ADU |
| N_data: | 94 |
| [click on plot for closeup] |
| Plot 3 | | data source: | crires_dark
(QC1 database) |
| parameter | dataset: | darkmed | • |
| median: | 0.58333 | ADU |
| fixed thresholds: | -0.5...2.0 | ADU |
| N_data: | 94 |
| [click on plot for closeup] |

| Plot 4 | | data source: | crires_dark
(QC1 database) |
| parameter | dataset: | darkmed | • |
| median: | 0.75 | ADU |
| fixed thresholds: | 0.0...2.0 | ADU |
| N_data: | 94 |
| [click on plot for closeup] |
| Plot 5 | | data source: | crires_dark
(QC1 database) |
| parameter | dataset: | darkmed | • |
| median: | 10.29798 | ADU |
| fixed thresholds: | 0.0...20.0 | ADU |
| N_data: | 106 |
| [click on plot for closeup] |

| Plot 6 | | data source: | crires_dark
(QC1 database) |
| parameter | dataset: | darkmed | • |
| median: | 25.98232 | ADU |
| fixed thresholds: | 8.5...40.0 | ADU |
| N_data: | 110 |
| [click on plot for closeup] |
| Plot 7 | | data source: | crires_dark
(QC1 database) |
| parameter | dataset: | darkmed | • |
| median: | 22.00758 | ADU |
| fixed thresholds: | 4.0...37.0 | ADU |
| N_data: | 110 |
| [click on plot for closeup] |
| Plot 8 | | data source: | crires_dark
(QC1 database) |
| parameter | dataset: | darkmed | • |
| median: | 18.93182 | ADU |
| fixed thresholds: | 0.0...35.0 | ADU |
| N_data: | 105 |
| [click on plot for closeup] |
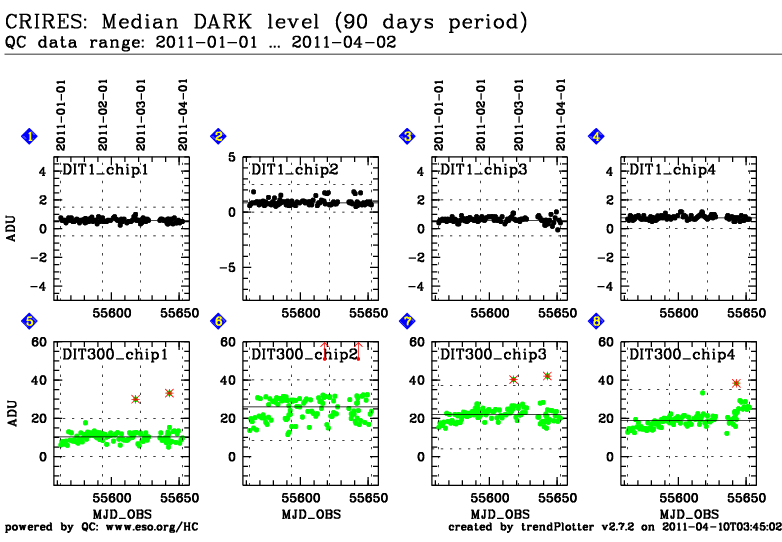
Trending plot for the median level in CRIRES DARK exposures.
The trending shows median levels from DIT=1sec and DIT=300sec exposures for all
four chips.
General information
Click on any of the plots to see a close-up version.
The latest date is indicated on top of the plot, data points belonging to that date are specially marked.
If configured,
- statistical averages are indicated by a solid line, and thresholds by broken lines
- outliers are marked by a red asterisk. They are defined as data points outside the
threshold lines
- "aliens" (= data points outside the plot Y limits) are marked by a red arrow (↑ or ↓)
- you can download the data for each parameter set if the 'Data downloads' link shows up
|
