Plot
? |
Symb
? |
Source
* |
OPS?
** |
Average ? |
Thresholds ? |
N_
data |
QC1
parameter |
Data
downloads |
Remarks |
| method |
value |
unit |
method |
value |
| 1 |
• | QC1DB |
no |
none |
|
arcsec |
none | |
266 |
fwhm_spec |
this |
last_yr |
all
|
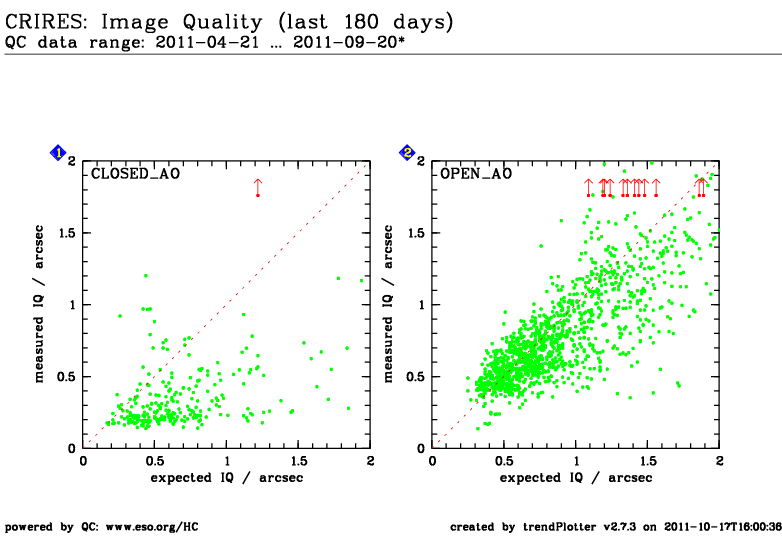
measured IQ vs. corrected DIMM seeing (closed AO loop) |
| 2 |
• | QC1DB |
no |
none |
|
arcsec |
none | |
1247 |
fwhm_spec |
this |
last_yr |
all
|
measured IQ vs. corrected DIMM seeing (open AO loop) |
| |
|
*Data sources: QC1DB: QC1 database; LOCAL: local text file | **OPS: to indicate that OPSLOG data are included
|
Plot 1
scores: not implemented
| | data source: | crires_sci
(QC1 database) |
| dataset: | fwhm_spec | • |
| average: | none |
| thresholds: | none |
| N_data plotted: | 266 |
| [click on plot for closeup] |
Plot 2
scores: not implemented
| | data source: | crires_sci
(QC1 database) |
| dataset: | fwhm_spec | • |
| average: | none |
| thresholds: | none |
| N_data plotted: | 1247 |
| [click on plot for closeup] |
Measured image quality versus expected image quality from science observations.
Measured image quality: median FWHM of cross-dispersion profile in combined frames.
Expected image quality: DIMM seeing corrected for telescope diameter, airmass, and wavelength.
Downloaded data for measured IQ come in pixels, correction is 0.086
arcsec/pix.
General information
Click on any of the plots to see a close-up version.
The latest date is indicated on top of the plot, data points belonging to that date are specially marked.
If configured,
- statistical averages are indicated by a solid line, and thresholds by broken lines
- outliers are marked by a red asterisk. They are defined as data points outside the
threshold lines
- "aliens" (= data points outside the plot Y limits) are marked by a red arrow (↑ or ↓)
- you can download the data for each parameter set if the 'Data downloads' link shows up
|
