Plot
? |
Symb
? |
Source
* |
OPS?
** |
Average ? |
Thresholds ? |
N_
data |
QC1
parameter |
Data
downloads |
Remarks |
| method |
value |
unit |
method |
value |
| 1 |
• | QC1DB |
no |
MEDIAN |
9.54e+04 |
none |
VAL | 75000,120000 |
89 |
resolution |
this |
last_yr |
all
|
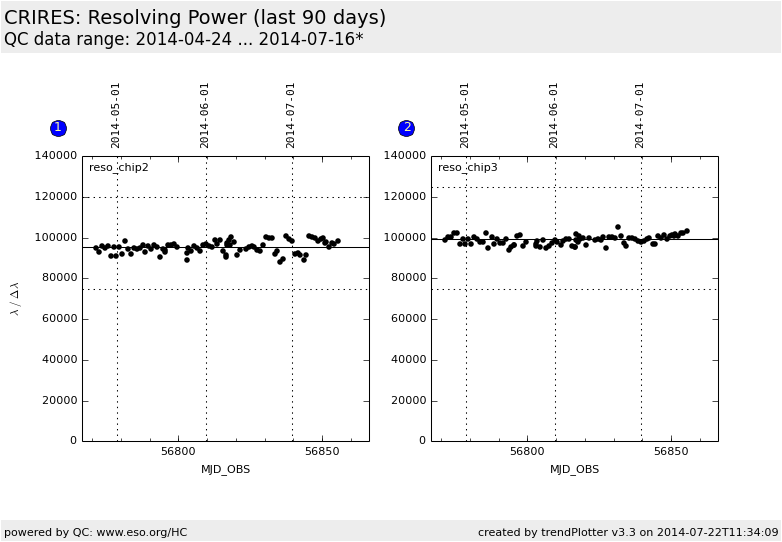
resolving power on chip2 |
| 2 |
• | QC1DB |
no |
MEDIAN |
9.91e+04 |
none |
VAL | 75000,125000 |
89 |
resolution |
this |
last_yr |
all
|
resolving power on chip3 |
| |
|
*Data sources: QC1DB: QC1 database; LOCAL: local text file | **OPS: OPSLOG data are included
|
Plot 1
scores:  8| 8|
| | data source: | crires_wave
(QC1 database) |
| dataset: | resolution | • |
| median: | 9.54e+04 | none |
| fixed thresholds: | 75000...120000 | none |
| N_data plotted: | 89 |
| [click on plot for closeup] |
Plot 2
scores: 8|
| | data source: | crires_wave
(QC1 database) |
| dataset: | resolution | • |
| median: | 9.91e+04 | none |
| fixed thresholds: | 75000...125000 | none |
| N_data plotted: | 89 |
| [click on plot for closeup] |
Wavelength calibration: trending of resolving power.
The resolvin power (lambda / Delta lambda) is monitored for the daily health
check setting with reference wavelength (on chip 3) of 1090.4 nm which uses a
ThAr lamp. It is determined from the median of the spectral lines identified
on each detector.
General information
Click on any of the plots to see a close-up version.
The latest date is indicated on top of the plot, data points belonging to that date are specially marked.
If configured,
- statistical averages are indicated by a solid line, and thresholds by broken lines
- outliers are marked by a red asterisk. They are defined as data points outside the
threshold lines
- "aliens" (= data points outside the plot Y limits) are marked by a red arrow (↑ or ↓)
- you can download the data for each parameter set if the 'Data downloads' link shows up
|
