Plot
? |
Symb
? |
Source
* |
Average ? |
Thresholds ? |
N_
data |
QC1
parameter |
Data
downloads |
Remarks |
| method |
value |
unit |
method |
value |
| 1 |
• | QC1DB |
MEDIAN |
1.13 |
e-/ADU |
none | |
69 |
gain_avg |
all (full time range)
| CONAD [e-/ADU], average of 16 read-out ports; RED detector |
| 2 |
• | QC1DB |
MEDIAN |
0.0133 |
e-/ADU |
none | |
69 |
gain_rms |
all (full time range)
| CONAD [e-/ADU], RMS over 16 read-out ports; RED detector |
| 3 |
• | QC1DB |
none |
|
e-/ADU |
none | |
69 |
gain_0_0 |
all (full time range)
| CONAD [e-/ADU], read-out port 0_0, RED detector |
| 3 |
• | QC1DB |
none |
|
e-/ADU |
none | |
69 |
gain_1_0 |
all (full time range)
| CONAD [e-/ADU], read-out port 1_0, RED detector |
| 3 |
• | QC1DB |
none |
|
e-/ADU |
none | |
69 |
gain_2_0 |
all (full time range)
| CONAD [e-/ADU], read-out port 2_0, RED detector |
| 3 |
• | QC1DB |
none |
|
e-/ADU |
none | |
69 |
gain_3_0 |
all (full time range)
| CONAD [e-/ADU], read-out port 3_0, RED detector |
| 3 |
• | QC1DB |
none |
|
e-/ADU |
none | |
69 |
gain_4_0 |
all (full time range)
| CONAD [e-/ADU], read-out port 4_0, RED detector |
| 3 |
• | QC1DB |
none |
|
e-/ADU |
none | |
69 |
gain_5_0 |
all (full time range)
| CONAD [e-/ADU], read-out port 5_0, RED detector |
| 3 |
• | QC1DB |
none |
|
e-/ADU |
none | |
69 |
gain_6_0 |
all (full time range)
| CONAD [e-/ADU], read-out port 6_0, RED detector |
| 3 |
• | QC1DB |
none |
|
e-/ADU |
none | |
69 |
gain_7_0 |
all (full time range)
| CONAD [e-/ADU], read-out port 7_0, RED detector |
| 3 |
• | QC1DB |
none |
|
e-/ADU |
none | |
69 |
gain_0_1 |
all (full time range)
| CONAD [e-/ADU], read-out port 0_1, RED detector |
| 3 |
• | QC1DB |
none |
|
e-/ADU |
none | |
69 |
gain_1_1 |
all (full time range)
| CONAD [e-/ADU], read-out port 1_1, RED detector |
| 3 |
• | QC1DB |
none |
|
e-/ADU |
none | |
69 |
gain_2_1 |
all (full time range)
| CONAD [e-/ADU], read-out port 2_1, RED detector |
| 3 |
• | QC1DB |
none |
|
e-/ADU |
none | |
69 |
gain_3_1 |
all (full time range)
| CONAD [e-/ADU], read-out port 3_1, RED detector |
| 3 |
• | QC1DB |
none |
|
e-/ADU |
none | |
69 |
gain_4_1 |
all (full time range)
| CONAD [e-/ADU], read-out port 4_1, RED detector |
| 3 |
• | QC1DB |
none |
|
e-/ADU |
none | |
69 |
gain_5_1 |
all (full time range)
| CONAD [e-/ADU], read-out port 5_1, RED detector |
| 3 |
• | QC1DB |
none |
|
e-/ADU |
none | |
69 |
gain_6_1 |
all (full time range)
| CONAD [e-/ADU], read-out port 6_1, RED detector |
| 3 |
• | QC1DB |
none |
|
e-/ADU |
none | |
69 |
gain_7_1 |
all (full time range)
| CONAD [e-/ADU], read-out port 7_1, RED detector |
| 4 |
• | QC1DB |
MEDIAN |
1.09 |
e-/ADU |
none | |
69 |
gain_avg |
all (full time range)
| CONAD [e-/ADU], average of 16 read-out ports; BLUE detector |
| 5 |
• | QC1DB |
MEDIAN |
0.012 |
e-/ADU |
none | |
69 |
gain_rms |
all (full time range)
| CONAD [e-/ADU], RMS over 16 read-out ports; BLUE detector |
| 6 |
• | QC1DB |
none |
|
e-/ADU |
none | |
69 |
gain_0_0 |
all (full time range)
| CONAD [e-/ADU], read-out port 0_0, BLUE detector |
| 6 |
• | QC1DB |
none |
|
e-/ADU |
none | |
69 |
gain_1_0 |
all (full time range)
| CONAD [e-/ADU], read-out port 1_0, BLUE detector |
| 6 |
• | QC1DB |
none |
|
e-/ADU |
none | |
69 |
gain_2_0 |
all (full time range)
| CONAD [e-/ADU], read-out port 2_0, BLUE detector |
| 6 |
• | QC1DB |
none |
|
e-/ADU |
none | |
69 |
gain_3_0 |
all (full time range)
| CONAD [e-/ADU], read-out port 3_0, BLUE detector |
| 6 |
• | QC1DB |
none |
|
e-/ADU |
none | |
69 |
gain_4_0 |
all (full time range)
| CONAD [e-/ADU], read-out port 4_0, BLUE detector |
| 6 |
• | QC1DB |
none |
|
e-/ADU |
none | |
69 |
gain_5_0 |
all (full time range)
| CONAD [e-/ADU], read-out port 5_0, BLUE detector |
| 6 |
• | QC1DB |
none |
|
e-/ADU |
none | |
69 |
gain_6_0 |
all (full time range)
| CONAD [e-/ADU], read-out port 6_0, BLUE detector |
| 6 |
• | QC1DB |
none |
|
e-/ADU |
none | |
69 |
gain_7_0 |
all (full time range)
| CONAD [e-/ADU], read-out port 7_0, BLUE detector |
| 6 |
• | QC1DB |
none |
|
e-/ADU |
none | |
69 |
gain_0_1 |
all (full time range)
| CONAD [e-/ADU], read-out port 0_1, BLUE detector |
| 6 |
• | QC1DB |
none |
|
e-/ADU |
none | |
69 |
gain_1_1 |
all (full time range)
| CONAD [e-/ADU], read-out port 1_1, BLUE detector |
| 6 |
• | QC1DB |
none |
|
e-/ADU |
none | |
69 |
gain_2_1 |
all (full time range)
| CONAD [e-/ADU], read-out port 2_1, BLUE detector |
| 6 |
• | QC1DB |
none |
|
e-/ADU |
none | |
69 |
gain_3_1 |
all (full time range)
| CONAD [e-/ADU], read-out port 3_1, BLUE detector |
| 6 |
• | QC1DB |
none |
|
e-/ADU |
none | |
69 |
gain_4_1 |
all (full time range)
| CONAD [e-/ADU], read-out port 4_1, BLUE detector |
| 6 |
• | QC1DB |
none |
|
e-/ADU |
none | |
69 |
gain_5_1 |
all (full time range)
| CONAD [e-/ADU], read-out port 5_1, BLUE detector |
| 6 |
• | QC1DB |
none |
|
e-/ADU |
none | |
69 |
gain_6_1 |
all (full time range)
| CONAD [e-/ADU], read-out port 6_1, BLUE detector |
| 6 |
• | QC1DB |
none |
|
e-/ADU |
none | |
69 |
gain_7_1 |
all (full time range)
| CONAD [e-/ADU], read-out port 7_1, BLUE detector |
| |
|
*Data sources: QC1DB: QC1 database; LOCAL: local data source
|
Plot 1
scores: not implemented
| | data source: | espresso_ledff
(QC1 database) |
| dataset: | gain_avg | • |
| median: | 1.13 | e-/ADU |
| thresholds: | none | |
| N_data plotted: | 69 |
| [click plot for closeup] |
Plot 2
scores: not implemented
| | data source: | espresso_ledff
(QC1 database) |
| dataset: | gain_rms | • |
| median: | 0.0133 | e-/ADU |
| thresholds: | none | |
| N_data plotted: | 69 |
| [click plot for closeup] |
Plot 3
scores: not implemented
| | data source: | espresso_ledff
(QC1 database) |
dataset:
(numbers below apply to this dataset) | gain_0_0 | • |
| average: | none |
| thresholds: | none |
| N_data plotted: | 69 |
| [click plot for closeup] |
Plot 4
scores: not implemented
| | data source: | espresso_ledff
(QC1 database) |
| dataset: | gain_avg | • |
| median: | 1.09 | e-/ADU |
| thresholds: | none | |
| N_data plotted: | 69 |
| [click plot for closeup] |
Plot 5
scores: not implemented
| | data source: | espresso_ledff
(QC1 database) |
| dataset: | gain_rms | • |
| median: | 0.012 | e-/ADU |
| thresholds: | none | |
| N_data plotted: | 69 |
| [click plot for closeup] |
Plot 6
scores: not implemented
| | data source: | espresso_ledff
(QC1 database) |
dataset:
(numbers below apply to this dataset) | gain_0_0 | • |
| average: | none |
| thresholds: | none |
| N_data plotted: | 69 |
| [click plot for closeup] |
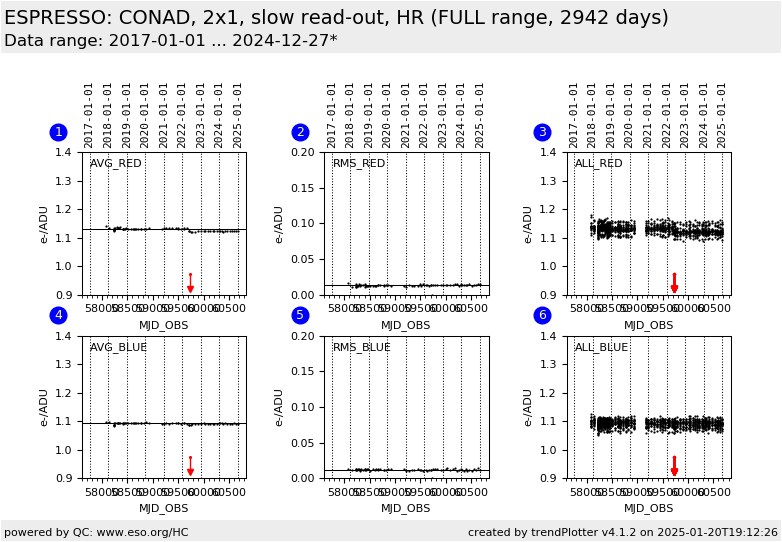
Trending plot for the conversion factor CONAD in e-/ADU as determined from LED
flat-field calibrations.
ESPRESSO has two chips, one for the BLUE and one for the RED arm. Each chip
has 16 read-out ports. QC parameters are determined per read-out port which
leads to 16 different values for each QC parameter per chip. The HC plots show
in
separate sub plots the
average (AVG) of all 16 values per detector, the RMS of these values, and ALL
16 individual values (in one sub plot).
General information
Click on any of the plots to see a close-up version.
The latest date is indicated on top of the plot.
If configured,
- data points belonging to the latest date are specially marked
- statistical averages are indicated by a solid line, and thresholds by broken lines
- outliers are marked by a red asterisk. They are defined as data points outside the
threshold lines
- "aliens" (= data points outside the plot Y limits) are marked by a red arrow (↑ or ↓)
- you can download the data for each parameter set if the 'Data downloads' link shows up
|
