Plot
? |
Symb
? |
Source
* |
Average ? |
Thresholds ? |
N_
data |
QC1
parameter |
Data
downloads |
Remarks |
| method |
value |
unit |
method |
value |
| 1 |
• | QC1DB |
none |
|
NONE |
none | |
33 |
extcorr_abseff_max |
all (full time range)
| absolute efficiency, MULTIMR, 4x2 binning, UT1234 |
| 2 |
• | QC1DB |
none |
|
NONE |
none | |
25 |
extcorr_abseff_max |
all (full time range)
| absolute efficiency, MULTIMR, 8x4 binning, UT1234 |
| |
|
*Data sources: QC1DB: QC1 database; LOCAL: local data source
|
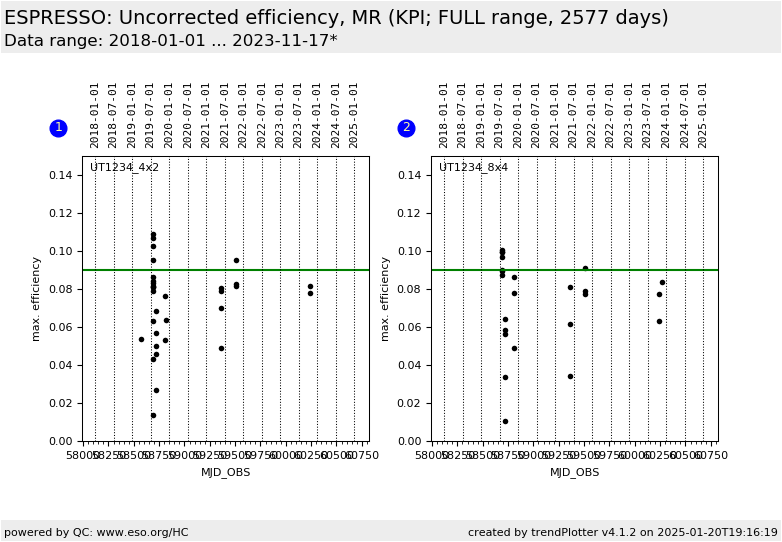
| Plot 1 | | data source: | espresso_std
(QC1 database) |
| dataset: | extcorr_abseff_max | • |
| average: | none |
| thresholds: | none |
| N_data plotted: | 33 |
| (current) reference: | 0.09 |
| [click plot for closeup] |
| Plot 2 | | data source: | espresso_std
(QC1 database) |
| dataset: | extcorr_abseff_max | • |
| average: | none |
| thresholds: | none |
| N_data plotted: | 25 |
| (current) reference: | 0.09 |
| [click plot for closeup] |
KPI plot for absolute efficiency as derived from standard star observations.
Values are corrected for extinction and but not for losses due to the fibre size.
The KPI reference values are based on measurements during commissioning in 2018
as reported in the User Manual v1.3. They are 4%, 9%, and 9% for
UHR, HR, and MR, respectively.
General information
Click on any of the plots to see a close-up version.
The latest date is indicated on top of the plot.
If configured,
- data points belonging to the latest date are specially marked
- statistical averages are indicated by a solid line, and thresholds by broken lines
- outliers are marked by a red asterisk. They are defined as data points outside the
threshold lines
- "aliens" (= data points outside the plot Y limits) are marked by a red arrow (↑ or ↓)
- you can download the data for each parameter set if the 'Data downloads' link shows up
|
