Plot
? |
Symb
? |
Source
* |
Average ? |
Thresholds ? |
N_
data |
QC1
parameter |
Data
downloads |
Remarks |
| method |
value |
unit |
method |
value |
| 1 |
• | QC1DB |
none |
|
e-/ADU |
none | |
151 |
gain_0_1 |
all (full time range)
| CONAD [e-/ADU], read-out port 0_1, BLUE detector |
| 2 |
• | QC1DB |
none |
|
e-/ADU |
none | |
151 |
gain_1_1 |
all (full time range)
| CONAD [e-/ADU], read-out port 1_1, BLUE detector |
| 3 |
• | QC1DB |
none |
|
e-/ADU |
none | |
151 |
gain_2_1 |
all (full time range)
| CONAD [e-/ADU], read-out port 2_1, BLUE detector |
| 4 |
• | QC1DB |
none |
|
e-/ADU |
none | |
151 |
gain_3_1 |
all (full time range)
| CONAD [e-/ADU], read-out port 3_1, BLUE detector |
| 5 |
• | QC1DB |
none |
|
e-/ADU |
none | |
151 |
gain_0_0 |
all (full time range)
| CONAD [e-/ADU], read-out port 0_0, BLUE detector |
| 6 |
• | QC1DB |
none |
|
e-/ADU |
none | |
151 |
gain_1_0 |
all (full time range)
| CONAD [e-/ADU], read-out port 1_0, BLUE detector |
| 7 |
• | QC1DB |
none |
|
e-/ADU |
none | |
151 |
gain_2_0 |
all (full time range)
| CONAD [e-/ADU], read-out port 2_0, BLUE detector |
| 8 |
• | QC1DB |
none |
|
e-/ADU |
none | |
151 |
gain_3_0 |
all (full time range)
| CONAD [e-/ADU], read-out port 3_0, BLUE detector |
| |
|
*Data sources: QC1DB: QC1 database; LOCAL: local data source
|
| Plot 1 | | data source: | espresso_ledff
(QC1 database) |
| dataset: | gain_0_1 | • |
| average: | none |
| thresholds: | none |
| N_data plotted: | 151 |
| (current) reference: | 1.1 |
| [click plot for closeup] |
| Plot 2 | | data source: | espresso_ledff
(QC1 database) |
| dataset: | gain_1_1 | • |
| average: | none |
| thresholds: | none |
| N_data plotted: | 151 |
| (current) reference: | 1.1 |
| [click plot for closeup] |
| Plot 3 | | data source: | espresso_ledff
(QC1 database) |
| dataset: | gain_2_1 | • |
| average: | none |
| thresholds: | none |
| N_data plotted: | 151 |
| (current) reference: | 1.1 |
| [click plot for closeup] |
| Plot 4 | | data source: | espresso_ledff
(QC1 database) |
| dataset: | gain_3_1 | • |
| average: | none |
| thresholds: | none |
| N_data plotted: | 151 |
| (current) reference: | 1.1 |
| [click plot for closeup] |
| Plot 5 | | data source: | espresso_ledff
(QC1 database) |
| dataset: | gain_0_0 | • |
| average: | none |
| thresholds: | none |
| N_data plotted: | 151 |
| (current) reference: | 1.1 |
| [click plot for closeup] |
| Plot 6 | | data source: | espresso_ledff
(QC1 database) |
| dataset: | gain_1_0 | • |
| average: | none |
| thresholds: | none |
| N_data plotted: | 151 |
| (current) reference: | 1.1 |
| [click plot for closeup] |
| Plot 7 | | data source: | espresso_ledff
(QC1 database) |
| dataset: | gain_2_0 | • |
| average: | none |
| thresholds: | none |
| N_data plotted: | 151 |
| (current) reference: | 1.1 |
| [click plot for closeup] |
| Plot 8 | | data source: | espresso_ledff
(QC1 database) |
| dataset: | gain_3_0 | • |
| average: | none |
| thresholds: | none |
| N_data plotted: | 151 |
| (current) reference: | 1.1 |
| [click plot for closeup] |
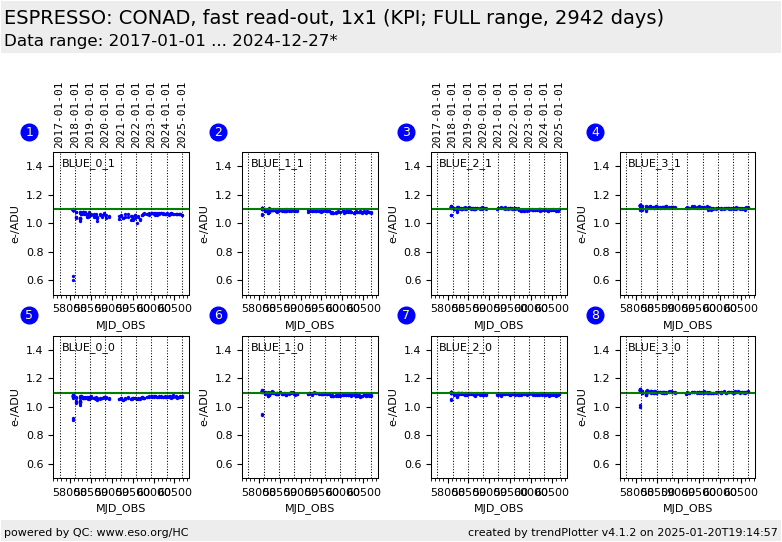
KPI plot for CONAD [e-/ADU] as determined from LED flat-field calibrations.
The ESPRESSO detector can be operated with slow or fast read-out.
It consists of two chips, one for the BLUE and one for the RED arm. Each chip
has 16 read-out ports. QC parameters are determined per read-out port which
leads to 16 different values for each QC parameter per chip.
The KPI plots are devided into fast and slow read-out. For each read-out mode,
there are two plots for the red and two for the blue chip, each plot showing
the values for eight read-out ports.
The labels come in the form <DET>_<X>_<Y> with
<DET> being the chip (BLUE or RED), <X> the x positions of the
read-out on the chip (0, 1, to 7), and <Y> the y position (0 or 1).
The KPI reference values are as given in the User Manual v1.3.
General information
Click on any of the plots to see a close-up version.
The latest date is indicated on top of the plot.
If configured,
- data points belonging to the latest date are specially marked
- statistical averages are indicated by a solid line, and thresholds by broken lines
- outliers are marked by a red asterisk. They are defined as data points outside the
threshold lines
- "aliens" (= data points outside the plot Y limits) are marked by a red arrow (↑ or ↓)
- you can download the data for each parameter set if the 'Data downloads' link shows up
|