Plot
? |
Symb
? |
Source
* |
Average ? |
Thresholds ? |
N_
data |
QC1
parameter |
Data
downloads |
Remarks |
| method |
value |
unit |
method |
value |
| 1 |
• | QC1DB |
none |
|
px |
none | |
3442 |
fiba_drift_mean_blue |
all (full time range)
| pixel shift from ThAr_FP, blue chip |
| 2 |
• | QC1DB |
none |
|
px |
none | |
3442 |
fiba_drift_mean_red |
all (full time range)
| pixel shift from ThAr_FP, red chip |
| 3 |
• | QC1DB |
none |
|
cm/s/h |
none | |
3442 |
fiba_drift_mean_blue |
all (full time range)
| drift from ThAr_FP, blue chip |
| 4 |
• | QC1DB |
none |
|
cm/s/h |
none | |
3442 |
fiba_drift_mean_red |
all (full time range)
| drift from ThAr_FP, red chip |
| 5 |
• | QC1DB |
none |
|
px |
none | |
3428 |
fibb_drift_mean_blue |
all (full time range)
| pixel shift from FP_ThAr, blue chip |
| 6 |
• | QC1DB |
none |
|
px |
none | |
3428 |
fibb_drift_mean_red |
all (full time range)
| pixel shift from FP_ThAr, red chip |
| 7 |
• | QC1DB |
none |
|
cm/s/h |
none | |
3428 |
fibb_drift_mean_blue |
all (full time range)
| drift from FP_ThAr, blue chip |
| 8 |
• | QC1DB |
none |
|
cm/s/h |
none | |
3428 |
fibb_drift_mean_red |
all (full time range)
| drift from FP_ThAr, red chip |
| |
|
*Data sources: QC1DB: QC1 database; LOCAL: local data source
|
| Plot 1 | | data source: | espresso_wave_thar_a
(QC1 database) |
| dataset: | fiba_drift_mean_blue | • |
| average: | none |
| thresholds: | none |
| N_data plotted: | 3442 |
| (current) reference: | undefined |
| [click plot for closeup] |
| Plot 2 | | data source: | espresso_wave_thar_a
(QC1 database) |
| dataset: | fiba_drift_mean_red | • |
| average: | none |
| thresholds: | none |
| N_data plotted: | 3442 |
| (current) reference: | undefined |
| [click plot for closeup] |
| Plot 3 | | data source: | espresso_wave_thar_a
(QC1 database) |
| dataset: | fiba_drift_mean_blue | • |
| average: | none |
| thresholds: | none |
| N_data plotted: | 3442 |
| (current) reference: | 10 |
| [click plot for closeup] |
| Plot 4 | | data source: | espresso_wave_thar_a
(QC1 database) |
| dataset: | fiba_drift_mean_red | • |
| average: | none |
| thresholds: | none |
| N_data plotted: | 3442 |
| (current) reference: | 10 |
| [click plot for closeup] |
| Plot 5 | | data source: | espresso_wave_thar_b
(QC1 database) |
| dataset: | fibb_drift_mean_blue | • |
| average: | none |
| thresholds: | none |
| N_data plotted: | 3428 |
| (current) reference: | undefined |
| [click plot for closeup] |
| Plot 6 | | data source: | espresso_wave_thar_b
(QC1 database) |
| dataset: | fibb_drift_mean_red | • |
| average: | none |
| thresholds: | none |
| N_data plotted: | 3428 |
| (current) reference: | undefined |
| [click plot for closeup] |
| Plot 7 | | data source: | espresso_wave_thar_b
(QC1 database) |
| dataset: | fibb_drift_mean_blue | • |
| average: | none |
| thresholds: | none |
| N_data plotted: | 3428 |
| (current) reference: | 10 |
| [click plot for closeup] |
| Plot 8 | | data source: | espresso_wave_thar_b
(QC1 database) |
| dataset: | fibb_drift_mean_red | • |
| average: | none |
| thresholds: | none |
| N_data plotted: | 3428 |
| (current) reference: | 10 |
| [click plot for closeup] |
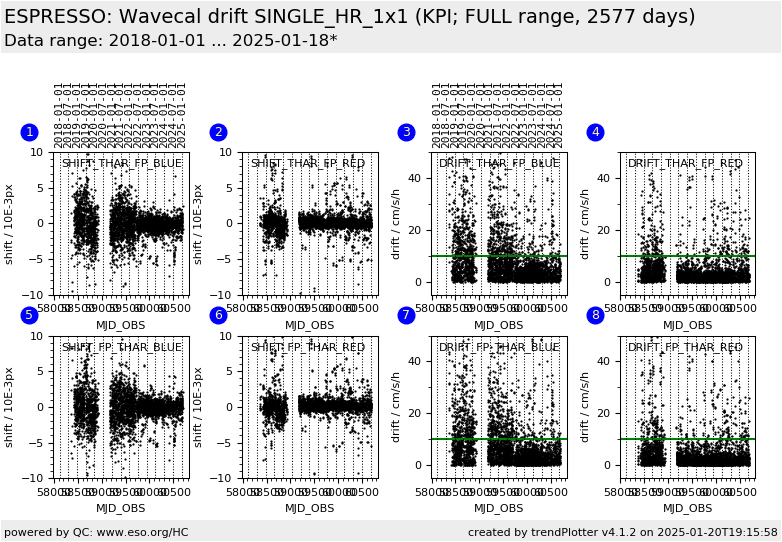
THIS KPI PLOT IS PURELY EXPERIMENTAL!!!
Trending plot for drift measurements.
These are wavelength calibrations that are measured typically during the afternoon
with ThAr in one fibre and Fabry-Perot (FP) in the other fibre. The FP lines are compared
to a reference (typically from the morning calibrations) and a shift in pixels is
determined. This shift is converted into a radial velocity precision, 0.002 pixels correspond to
1 m/s, and devided by the time difference to the reference.
Plots 1, 2, 5, and 6 show the shift in pixels; plots 3, 4, 7, and 8 the converted values
in cm/s/h. Only measurements where the time difference to the FP reference is at least one hour
are plotted.
Downloaded values are always in pixels, the conversion to cm/s/h is done internally. Also all
measurements are available including values where the time difference is less than one hour. This
can be checked with the delta_time_fp column that has the time difference in fractions of day.
General information
Click on any of the plots to see a close-up version.
The latest date is indicated on top of the plot.
If configured,
- data points belonging to the latest date are specially marked
- statistical averages are indicated by a solid line, and thresholds by broken lines
- outliers are marked by a red asterisk. They are defined as data points outside the
threshold lines
- "aliens" (= data points outside the plot Y limits) are marked by a red arrow (↑ or ↓)
- you can download the data for each parameter set if the 'Data downloads' link shows up
|