|
|
| ESPRESSO trending system: FULL report |
|
|
| Last update: 2025-01-20T19:41:59 (UT)
|
|
|
|
|
*Date on this monitor changes at 21:00 UT |
|

|
|
|
Plot
? |
Symb
? |
Source
* |
Average ? |
Thresholds ? |
N_
data |
QC1
parameter |
Data
downloads |
Remarks |
| method |
value |
unit |
method |
value |
| 1 |
• | QC1DB |
MEDIAN |
7.21e+04 |
NONE |
none | |
360 |
fiba_resol_med |
all (full time range)
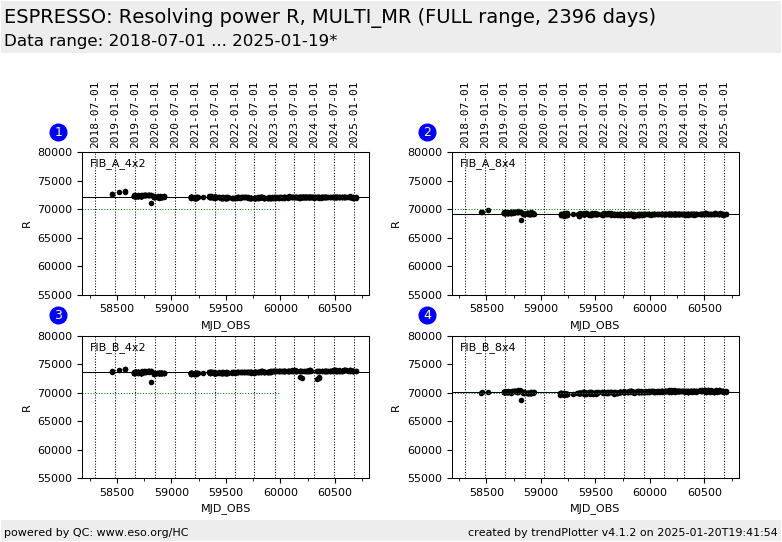
| resolving power R, fibre A, 4x2 binning |
| 2 |
• | QC1DB |
MEDIAN |
6.92e+04 |
NONE |
none | |
336 |
fiba_resol_med |
all (full time range)
| resolving power R, fibre A, 8x4 binning |
| 3 |
• | QC1DB |
MEDIAN |
7.36e+04 |
NONE |
none | |
329 |
fibb_resol_med |
all (full time range)
| resolving power R, fibre B, 4x2 binning |
| 4 |
• | QC1DB |
MEDIAN |
7.01e+04 |
NONE |
none | |
352 |
fibb_resol_med |
all (full time range)
| resolving power R, fibre B, 8x4 binning |
| |
|
*Data sources: QC1DB: QC1 database; LOCAL: local data source
|
Plot 1
scores: not implemented
| | data source: | espresso_wave_thar_a
(QC1 database) |
| dataset: | fiba_resol_med | • |
| median: | 7.21e+04 | NONE |
| thresholds: | none | |
| N_data plotted: | 360 |
| [click plot for closeup] |
Plot 2
scores: not implemented
| | data source: | espresso_wave_thar_a
(QC1 database) |
| dataset: | fiba_resol_med | • |
| median: | 6.92e+04 | NONE |
| thresholds: | none | |
| N_data plotted: | 336 |
| [click plot for closeup] |
Plot 3
scores: not implemented
| | data source: | espresso_wave_thar_b
(QC1 database) |
| dataset: | fibb_resol_med | • |
| median: | 7.36e+04 | NONE |
| thresholds: | none | |
| N_data plotted: | 329 |
| [click plot for closeup] |
Plot 4
scores: not implemented
| | data source: | espresso_wave_thar_b
(QC1 database) |
| dataset: | fibb_resol_med | • |
| median: | 7.01e+04 | NONE |
| thresholds: | none | |
| N_data plotted: | 352 |
| [click plot for closeup] |
Trending plot for spectral resolving power R as measured with Th-Ar arc lines.
General information
Click on any of the plots to see a close-up version.
The latest date is indicated on top of the plot.
If configured,
- data points belonging to the latest date are specially marked
- statistical averages are indicated by a solid line, and thresholds by broken lines
- outliers are marked by a red asterisk. They are defined as data points outside the
threshold lines
- "aliens" (= data points outside the plot Y limits) are marked by a red arrow (↑ or ↓)
- you can download the data for each parameter set if the 'Data downloads' link shows up
|
|