[an error occurred while processing this directive]
ESPRESSO trending system: FULL report
Last update: 2025-01-20T19:41:59 (UT)
[enable javascript for displaying time difference!]
General news:
NOTE: The Health Check and calChecker services are moved to qcFlow on an instrument by instrument basis. The current pages will not be updated any longer once the move has been finished.
ESPRESSO news:
Updating of the ESPRESSO HC has been stopped on 21 Jan 2025. Please refer to the qcFlow generated Health Check.
Report news:
[an error occurred while processing this directive]
Plot? Symb? Source Average ? Thresholds ? N_ QC1 Data Remarks
method value unit method value
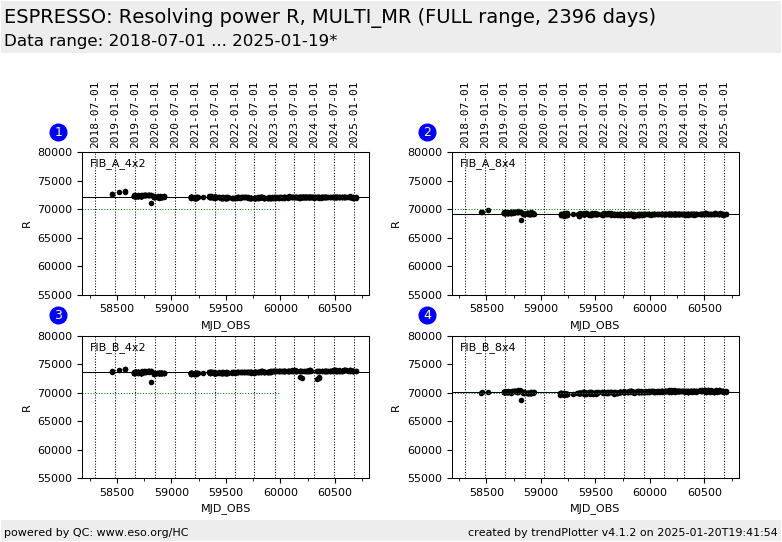
1
• QC1DB MEDIAN 7.21e+04 NONE none 360 fiba_resol_med
all (full time range)
resolving power R, fibre A, 4x2 binning
2
• QC1DB MEDIAN 6.92e+04 NONE none 336 fiba_resol_med
all (full time range)
resolving power R, fibre A, 8x4 binning
3
• QC1DB MEDIAN 7.36e+04 NONE none 329 fibb_resol_med
all (full time range)
resolving power R, fibre B, 4x2 binning
4
• QC1DB MEDIAN 7.01e+04 NONE none 352 fibb_resol_med
all (full time range)
resolving power R, fibre B, 8x4 binning
*Data sources: QC1DB: QC1 database; LOCAL: local data source
Plot 1 scores: not implemented
data source: espresso_wave_thar_a dataset: fiba_resol_med • median: 7.21e+04 NONE thresholds: none N_data plotted: 360 [click plot for closeup]
Plot 2 scores: not implemented
data source: espresso_wave_thar_a dataset: fiba_resol_med • median: 6.92e+04 NONE thresholds: none N_data plotted: 336 [click plot for closeup]
Plot 3 scores: not implemented
data source: espresso_wave_thar_b dataset: fibb_resol_med • median: 7.36e+04 NONE thresholds: none N_data plotted: 329 [click plot for closeup]
Plot 4 scores: not implemented
data source: espresso_wave_thar_b dataset: fibb_resol_med • median: 7.01e+04 NONE thresholds: none N_data plotted: 352 [click plot for closeup]
This plot
Trending plot for spectral resolving power R as measured with Th-Ar arc lines.
General information
Click on any of the plots to see a close-up version .
The latest date is indicated on top of the plot.
If configured,
data points belonging to the latest date are specially marked statistical averages are indicated by a solid line, and thresholds by broken lines outliers are marked by a red asterisk. They are defined as data points outside the
threshold lines "aliens" (= data points outside the plot Y limits) are marked by a red arrow (↑ ↓ you can download the data for each parameter set if the 'Data downloads' link shows up
