[page auto-refreshes after 60 sec]            [press Ctrl+R to enforce refresh of scores and dates]
FORS1 trending system: History Plots
Last update: 2009-04-09T06:52:48 (UT)
| now: 2024-04-24T08:12:13 (UT)  
same group: dark linearity gain   conad fp_noise
close window history: 2008 2009   HEALTH
 
Print: Information and research: News:
- png file - advanced studies: QC1 browser | QC1 plotter
 
Plot
?
Symb
?
Source
*
OPS?
**
Average ? Thresholds ? N_
data
QC1
parameter
Data
downloads
Remarks
method value unit method value
1 QC1DB no MEDIAN 0.53934 e-/ADU VAL0.53,0.55 11 gain this | last_yr | all chip 1, high gain
2 QC1DB no MEDIAN 0.57794 e-/ADU VAL0.57,0.59 11 gain this | last_yr | all chip 2, high gain
3 QC1DB no MEDIAN 2.26585 e-/ADU VAL2.245,2.285 10 gain this | last_yr | all chip 1, low gain
4 QC1DB no MEDIAN 2.36176 e-/ADU VAL2.34,2.38 9 gain this | last_yr | all chip 2, low gain
*Data sources: QC1DB: QC1 database; LOCAL: local text file | **OPS: to indicate that OPSLOG data are included
This plot

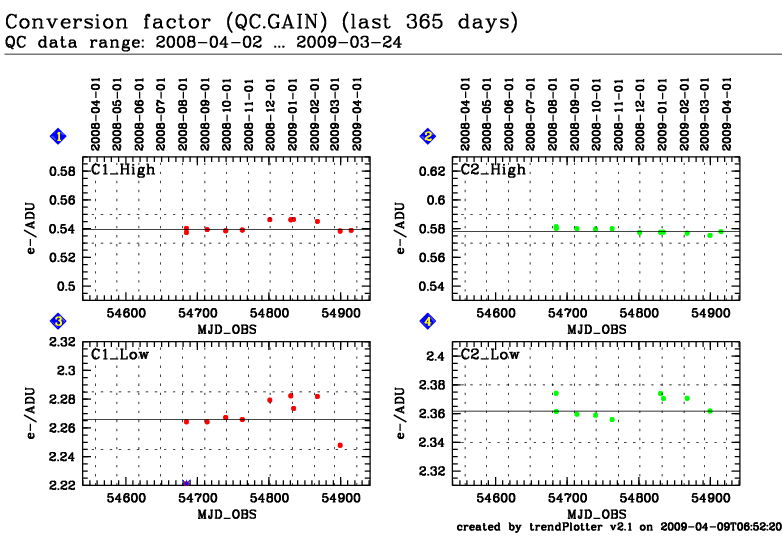
The gain is derived from a set of paired flat fields with identical exposure time, using the Photon Transfer Curve method. For more information see the tutorial page.  


General information

Click on any of the plots to see a close-up version. The latest date is indicated on top of the plot, data points belonging to that date are specially marked.

If configured,

  • statistical averages are indicated by a solid line, and thresholds by broken lines
  • outliers are marked by a red asterisk. They are defined as data points outside the threshold lines
  • "aliens" (= data points outside the plot Y limits) are marked by a red arrow ( or )
  • you can download the data for each parameter set if the 'Data downloads' link shows up