Plot
? |
Symb
? |
Source
* |
Average ? |
Thresholds ? |
N_
data |
QC1
parameter |
Data
downloads |
Remarks |
| method |
value |
unit |
method |
value |
| 1 |
• | QC1DB |
none |
|
e-/ADU |
none | |
72 |
gain |
all (full time range)
| gain for chip 1, high gain, R_SPECIAL |
| 1 |
• | QC1DB |
none |
|
e-/ADU |
none | |
134 |
gain |
all (full time range)
| gain for chip 1, high gain, non-R_SPECIAL |
| 1 |
o | QC1DB |
none |
|
e-/ADU |
none | |
206 |
gain |
all (full time range)
| gain for chip 1, high gain, all filters |
| 2 |
• | QC1DB |
none |
|
e-/ADU |
none | |
71 |
gain |
all (full time range)
| gain for chip 2, high gain, R_SPECIAL |
| 2 |
• | QC1DB |
none |
|
e-/ADU |
none | |
134 |
gain |
all (full time range)
| gain for chip 2, high gain, non-R_SPECIAL |
| 2 |
o | QC1DB |
none |
|
e-/ADU |
none | |
205 |
gain |
all (full time range)
| gain for chip 2, high gain, all filters |
| 3 |
• | QC1DB |
none |
|
e-/ADU |
none | |
73 |
gain |
all (full time range)
| gain for chip 1, low gain, R_SPECIAL |
| 3 |
• | QC1DB |
none |
|
e-/ADU |
none | |
162 |
gain |
all (full time range)
| gain for chip 1, low gain, non-R_SPECIAL |
| 3 |
o | QC1DB |
none |
|
e-/ADU |
none | |
235 |
gain |
all (full time range)
| gain for chip 1, low gain, all filters |
| 4 |
• | QC1DB |
none |
|
e-/ADU |
none | |
73 |
gain |
all (full time range)
| gain for chip 2, low gain, R_SPECIAL |
| 4 |
• | QC1DB |
none |
|
e-/ADU |
none | |
163 |
gain |
all (full time range)
| gain for chip 2, low gain, non-R_SPECIAL |
| 4 |
o | QC1DB |
none |
|
e-/ADU |
none | |
236 |
gain |
all (full time range)
| gain for chip 2, low gain, all filters |
| |
|
*Data sources: QC1DB: QC1 database; LOCAL: local data source
|
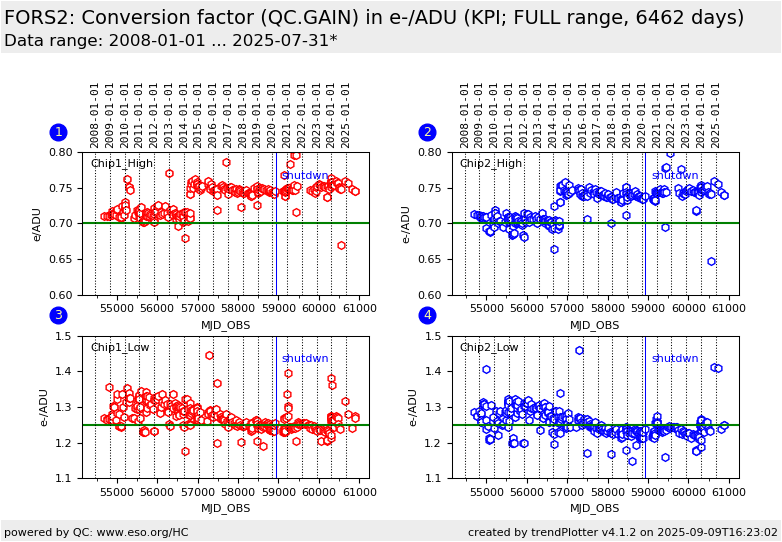
| Plot 1 | | data source: | fors2_detmon
(QC1 database) |
dataset:
(numbers below apply to this dataset) | gain | • |
| average: | none |
| thresholds: | none |
| N_data plotted: | 72 |
| (current) reference: | 0.7 |
| [click plot for closeup] |
| Plot 2 | | data source: | fors2_detmon
(QC1 database) |
dataset:
(numbers below apply to this dataset) | gain | • |
| average: | none |
| thresholds: | none |
| N_data plotted: | 71 |
| (current) reference: | 0.7 |
| [click plot for closeup] |
| Plot 3 | | data source: | fors2_detmon
(QC1 database) |
dataset:
(numbers below apply to this dataset) | gain | • |
| average: | none |
| thresholds: | none |
| N_data plotted: | 73 |
| (current) reference: | 1.25 |
| [click plot for closeup] |
| Plot 4 | | data source: | fors2_detmon
(QC1 database) |
dataset:
(numbers below apply to this dataset) | gain | • |
| average: | none |
| thresholds: | none |
| N_data plotted: | 73 |
| (current) reference: | 1.25 |
| [click plot for closeup] |
General information
Click on any of the plots to see a close-up version.
The latest date is indicated on top of the plot.
If configured,
- data points belonging to the latest date are specially marked
- statistical averages are indicated by a solid line, and thresholds by broken lines
- outliers are marked by a red asterisk. They are defined as data points outside the
threshold lines
- "aliens" (= data points outside the plot Y limits) are marked by a red arrow (↑ or ↓)
- you can download the data for each parameter set if the 'Data downloads' link shows up
|
