FORS2 trending system: HEALTH CHECK report
Last update: 2019-12-07T00:36:07 (UT)
[enable javascript for displaying time difference!]
Plot? Symb? Source Average ? Thresholds ? N_ QC1 Data Remarks
method value unit method value
1
• QC1DB none mag none 19 ext_coeff
this |
last_yr |
all
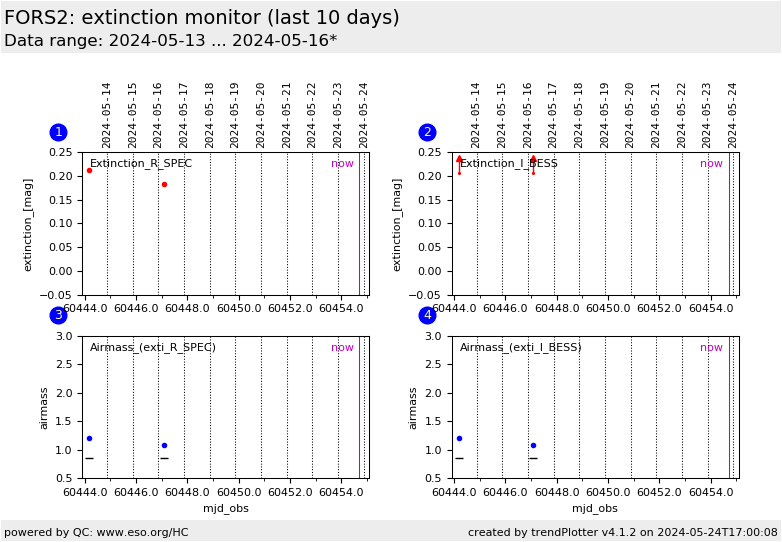
Frame extinction values from FORS2 STD_IMA data for R_SPEC. Values for num_stars <3 suppressed.
2
• QC1DB none mag none 19 ext_coeff
this |
last_yr |
all
same, for filter I_BESS
3
• QC1DB none NONE none 19 airmass
this |
last_yr |
all
Airmass for values in plot 1. For nights classified 'S' or 'Sb' there should always be a pair with delta_AIRM > 0.4. Data points per night are connected by a line.
3
– QC1DB none NONE none 7 mjd_obs
green bar: night has been classified 'S' (photometrically stable) or 'Sb' (photometric at begin but no more data later); red bar: 'N' (not stable); black bar: 'U' (unknown, no low-high-airmass pair taken); all data apply to the filter above
4
• QC1DB none NONE none 19 airmass
this |
last_yr |
all
same, for filter I_BESS
*Data sources: QC1DB: QC1 database; LOCAL: local data source
Plot 1 data source: fors2_zp_frame dataset: ext_coeff • average: none thresholds: none N_data plotted: 19 [click plot for closeup]
Plot 2 data source: fors2_zp_frame dataset: ext_coeff • average: none thresholds: none N_data plotted: 19 [click plot for closeup]
Plot 3 data source: fors2_zp_frame dataset: airmass • average: none thresholds: none N_data plotted: 19 [click plot for closeup]
Plot 4 data source: fors2_zp_frame dataset: airmass • average: none thresholds: none N_data plotted: 19 [click plot for closeup]
This plot
General information
Click on any of the plots to see a close-up version .
The latest date is indicated on top of the plot.
If configured,
data points belonging to the latest date are specially marked statistical averages are indicated by a solid line, and thresholds by broken lines outliers are marked by a red asterisk. They are defined as data points outside the
threshold lines "aliens" (= data points outside the plot Y limits) are marked by a red arrow (↑ ↓ you can download the data for each parameter set if the 'Data downloads' link shows up
