[page auto-refreshes after 300 sec]   [stop | on]            [press Ctrl+Shift+R to enforce refresh of scores, dates and news]
FORS2 trending system: HEALTH CHECK report
HELP USERS-GUIDE MORE
Last update: 2014-12-24T05:21:17 (UT)
  | now: 2024-04-26T03:41:17 (UT) muc01 QC pipeline: fors2-4.9.24 (installed 2014-10-20)
same group: R_SPEC I_BESS b_HIGH v_HIGH   U_SPEC B_BESS V_BESS
close window history: 2002 2003 2004 2005 2006 2007   2008   HEALTH
  ... ... ... ... ...
Print: Information and research:
- png file - advanced studies: QC1 browser | QC1 plotter
Plot
?
Symb
?
Source
*
OPS?
**
Average ? Thresholds ? N_
data
QC1
parameter
Data
downloads
Remarks
method value unit method value
1 QC1DB yes (0) none   mag none  0 zp_frame this | last_yr | all Frame zeropoint in e- (more than 1 star)
1 QC1DB yes (0) none   mag none  0 zp_frame this | last_yr | all Frame zeropoint in e- (1 star only)
1 QC1DB yes (0) MEDIAN   mag OFF  0 zp_frame this | last_yr | all Frame zeropoint in e- (photometric nights only)
2 QC1DB yes (0) MEDIAN   mag VAL0,0.07 0 sig_zp_frame this | last_yr | all error of frame zeropoint from e-/sec
3 QC1DB yes (0) none   mag none  0 zp_frame this | last_yr | all Frame zeropoint in e- (more than 1 star)
3 QC1DB yes (0) none   mag none  0 zp_frame this | last_yr | all Frame zeropoint in e- (1 star only)
3 QC1DB yes (0) MEDIAN   mag OFF  0 zp_frame this | last_yr | all Frame zeropoint in e- (photometric nights only)
4 QC1DB yes (0) MEDIAN   mag VAL0,0.07 0 sig_zp_frame this | last_yr | all error of frame zeropoint from e-/sec
*Data sources: QC1DB: QC1 database; LOCAL: local text file | **OPS: OPSLOG data are included
Plot 1
scores: not implemented
data source:fors2_zp_frame
(QC1 database)
dataset:
(numbers below apply to this dataset)
zp_frame
average:none
thresholds:none
N_data plotted:0
[click on plot for closeup]
Plot 3
scores: not implemented
data source:fors2_zp_frame
(QC1 database)
dataset:
(numbers below apply to this dataset)
zp_frame
average:none
thresholds:none
N_data plotted:0
[click on plot for closeup]
Plot 2
scores: not implemented
data source:fors2_zp_frame
(QC1 database)
dataset:sig_zp_frame
median:no datamag
fixed thresholds:0...0.07mag
N_data plotted:0
[click on plot for closeup]
Plot 4
scores: not implemented
data source:fors2_zp_frame
(QC1 database)
dataset:sig_zp_frame
median:no datamag
fixed thresholds:0...0.07mag
N_data plotted:0
[click on plot for closeup]
This plot

Values are generated for both CHIP1 and CHIP2, 2x2 binning only. Photometric nights are selected from the Absorption Monitor. Zeropoints are for flux in e-/sec, not in ADU. Do not use these zeropoints for science data. They are reduced assuming a standard extinction value, which may not be correct for an individual night! More information can be found on the plot tutorial page  


General information

Click on any of the plots to see a close-up version.

If applicable, the latest values from Paranal ops logs are plotted as blue dots. More information about those values, including a download option, is available in the OPS column.

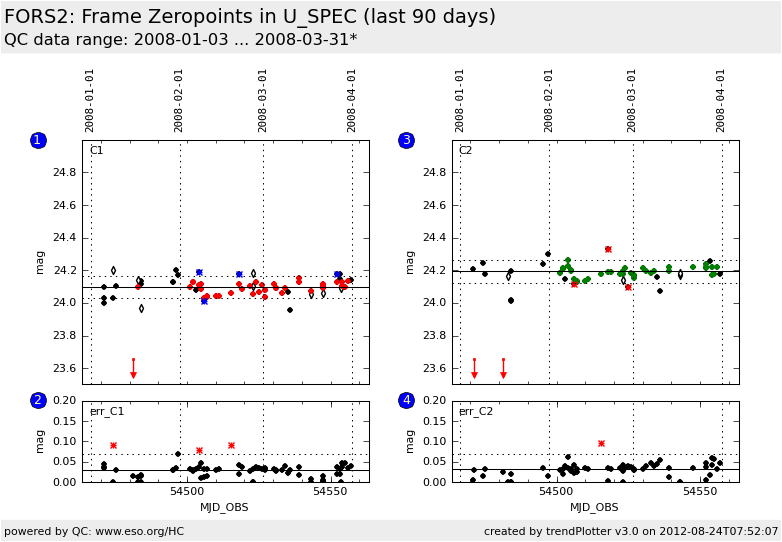
The latest date is indicated on top of the plot, data points belonging to that date are specially marked.

If configured,

  • statistical averages are indicated by a solid line, and thresholds by broken lines
  • outliers are marked by a red asterisk. They are defined as data points outside the threshold lines
  • "aliens" (= data points outside the plot Y limits) are marked by a red arrow ( or )
  • you can download the data for each parameter set if the 'Data downloads' link shows up