Plot
? |
Symb
? |
Source
* |
Average ? |
Thresholds ? |
N_
data |
QC1
parameter |
Data
downloads |
Remarks |
| method |
value |
unit |
method |
value |
| 1 |
• | QC1DB |
MEDIAN |
251 |
ADU |
3% | ± 7.53 |
72 |
median_master |
this |
last_yr |
all
|
median BIAS level |
| 2 |
• | QC1DB |
MEDIAN |
3.99 |
e- |
10% | ± 0.399 |
72 |
sigma_raw |
this |
last_yr |
all
|
RON in single raw frame
 downloaded data come in ADU (=e-/2.30) downloaded data come in ADU (=e-/2.30) |
| 3 |
• | QC1DB |
MEDIAN |
2.19 |
e- |
10% | ± 0.219 |
72 |
sigma_master |
this |
last_yr |
all
|
RON in master frame
downloaded data come in ADU (=e-/2.30) |
| 4 |
x | QC1DB |
MEDIAN |
0.071 |
ADU |
VAL | 0.05,0.12 |
72 |
struct_row |
this |
last_yr |
all
|
structure of master in X direction |
| 5 |
x | QC1DB |
MEDIAN |
0.379 |
ADU |
VAL | 0.1,0.5 |
72 |
struct_col |
this |
last_yr |
all
|
structure of master in Y direction |
| 6 |
• | QC1DB |
MEDIAN |
58.5 |
N |
VAL | 0,1000 |
72 |
bpm_npix |
this |
last_yr |
all
|
number of bad pixels |
| |
|
*Data sources: QC1DB: QC1 database; LOCAL: local data source
|
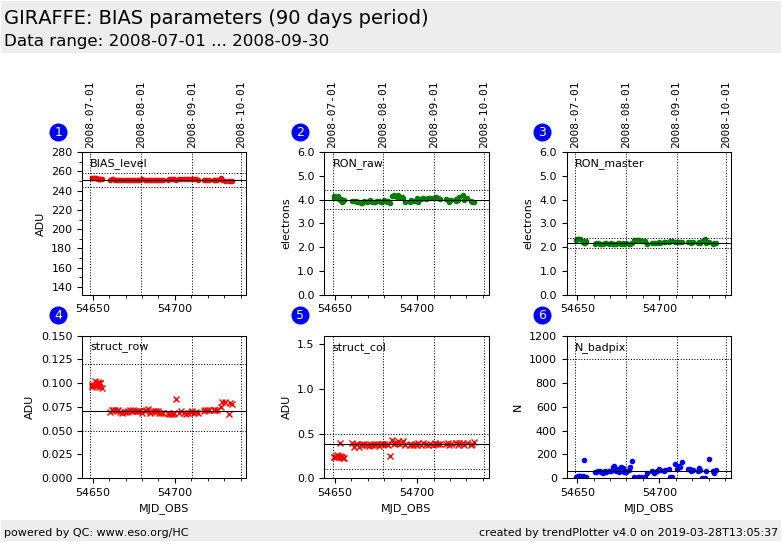
| Plot 1 | | data source: | giraffe_bias
(QC1 database) |
| dataset: | median_master | • |
| median: | 251 | ADU |
| rel. thresholds: ±3% | 243.474365...258.534635 | ADU |
| N_data plotted: | 72 |
| [click plot for closeup] |
| Plot 2 | | data source: | giraffe_bias
(QC1 database) |
| dataset: | sigma_raw | • |
| median: | 3.99 | e- |
| rel. thresholds: ±10% | 3.588345...4.385755 | e- |
| N_data plotted: | 72 |
| [click plot for closeup] |
| Plot 3 | | data source: | giraffe_bias
(QC1 database) |
| dataset: | sigma_master | • |
| median: | 2.19 | e- |
| rel. thresholds: ±10% | 1.967535...2.404765 | e- |
| N_data plotted: | 72 |
| [click plot for closeup] |
| Plot 4 | | data source: | giraffe_bias
(QC1 database) |
| dataset: | struct_row | x |
| median: | 0.071 | ADU |
| fixed thresholds: | 0.05...0.12 | ADU |
| N_data plotted: | 72 |
| [click plot for closeup] |
| Plot 5 | | data source: | giraffe_bias
(QC1 database) |
| dataset: | struct_col | x |
| median: | 0.379 | ADU |
| fixed thresholds: | 0.1...0.5 | ADU |
| N_data plotted: | 72 |
| [click plot for closeup] |
| Plot 6 | | data source: | giraffe_bias
(QC1 database) |
| dataset: | bpm_npix | • |
| median: | 58.5 | N |
| fixed thresholds: | 0...1000 | N |
| N_data plotted: | 72 |
| [click plot for closeup] |
This is the trending plot for the GIRAFFE QC parameters derived from BIAS frames.
These plots describe:
1. the BIAS level in masterbias frames,
2. the read noise (RON) of a single raw frame,
3. the read noise (RON) of a master frame,
4. the collapsed structure of a masterbias in X direction,
5. the collapsed structure in Y direction,
6. the number of bad pixels.
Find more information about GIRAFFE BIAS frames
here.
Other QC parameters related to detector properties (like contamination,
linearity, gain) are trended
here.
General information
Click on any of the plots to see a close-up version.
The latest date is indicated on top of the plot.
If configured,
- data points belonging to the latest date are specially marked
- statistical averages are indicated by a solid line, and thresholds by broken lines
- outliers are marked by a red asterisk. They are defined as data points outside the
threshold lines
- "aliens" (= data points outside the plot Y limits) are marked by a red arrow (↑ or ↓)
- you can download the data for each parameter set if the 'Data downloads' link shows up
|
