Plot
? |
Symb
? |
Source
* |
Average ? |
Thresholds ? |
N_
data |
QC1
parameter |
Data
downloads |
Remarks |
| method |
value |
unit |
method |
value |
| 1 |
• | QC1DB |
MEDIAN |
3.06e+04 |
N |
none | |
2165 |
mean_R |
all (full time range)
| resolving power R (λ0/Δλ) H525.8B, Medusa1 |
| 1 |
• | QC1DB |
none |
|
N |
none | |
20 |
mean_R |
all (full time range)
| same, initial years, from reprocessing |
| 2 |
x | QC1DB |
MEDIAN |
3.07e+04 |
N |
none | |
2144 |
mean_R |
all (full time range)
| as plot 1, Medusa2 |
| 2 |
• | QC1DB |
none |
|
N |
none | |
18 |
mean_R |
all (full time range)
| same, initial years, from reprocessing |
| 3 |
∗ | QC1DB |
MEDIAN |
4.68e+04 |
N |
none | |
1051 |
mean_R |
all (full time range)
| as plot 1, IFU1 (no reprocessing) |
| 4 |
▲ | QC1DB |
MEDIAN |
4.63e+04 |
N |
none | |
1070 |
mean_R |
all (full time range)
| as plot 1, IFU2 |
| 5 |
• | QC1DB |
MEDIAN |
4.93e+04 |
N |
none | |
1044 |
mean_R |
all (full time range)
| as plot 1, Argus |
|
| 6 |
• | QC1DB |
MEDIAN |
5.77e+03 |
N |
none | |
2503 |
mean_R |
all (full time range)
| resolving power R
L543.1, Medusa1 |
| 6 |
• | QC1DB |
none |
|
N |
none | |
43 |
mean_R |
all (full time range)
| |
| 7 |
x | QC1DB |
MEDIAN |
5.76e+03 |
N |
none | |
2485 |
mean_R |
all (full time range)
| as plot 6, Medusa2 |
| 7 |
x | QC1DB |
none |
|
N |
none | |
47 |
mean_R |
all (full time range)
| same, initial years, from reprocessing |
| |
|
*Data sources: QC1DB: QC1 database; LOCAL: local data source
|
Plot 1
scores: not implemented
| | data source: | giraffe_wave
(QC1 database) |
dataset:
(numbers below apply to this dataset) | mean_R | • |
| median: | 3.06e+04 | N |
| thresholds: | none | |
| N_data plotted: | 2165 |
| [click plot for closeup] |
Plot 2
scores: not implemented
| | data source: | giraffe_wave
(QC1 database) |
dataset:
(numbers below apply to this dataset) | mean_R | x |
| median: | 3.07e+04 | N |
| thresholds: | none | |
| N_data plotted: | 2144 |
| [click plot for closeup] |
Plot 3
scores: not implemented
| | data source: | giraffe_wave
(QC1 database) |
| dataset: | mean_R | ∗ |
| median: | 4.68e+04 | N |
| thresholds: | none | |
| N_data plotted: | 1051 |
| [click plot for closeup] |
Plot 4
scores: not implemented
| | data source: | giraffe_wave
(QC1 database) |
| dataset: | mean_R | ▲ |
| median: | 4.63e+04 | N |
| thresholds: | none | |
| N_data plotted: | 1070 |
| [click plot for closeup] |
Plot 5
scores: not implemented
| | data source: | giraffe_wave
(QC1 database) |
| dataset: | mean_R | • |
| median: | 4.93e+04 | N |
| thresholds: | none | |
| N_data plotted: | 1044 |
| [click plot for closeup] |
Plot 6
scores: not implemented
| | data source: | giraffe_wave
(QC1 database) |
dataset:
(numbers below apply to this dataset) | mean_R | • |
| median: | 5.77e+03 | N |
| thresholds: | none | |
| N_data plotted: | 2503 |
| [click plot for closeup] |
Plot 7
scores: not implemented
| | data source: | giraffe_wave
(QC1 database) |
dataset:
(numbers below apply to this dataset) | mean_R | x |
| median: | 5.76e+03 | N |
| thresholds: | none | |
| N_data plotted: | 2485 |
| [click plot for closeup] |
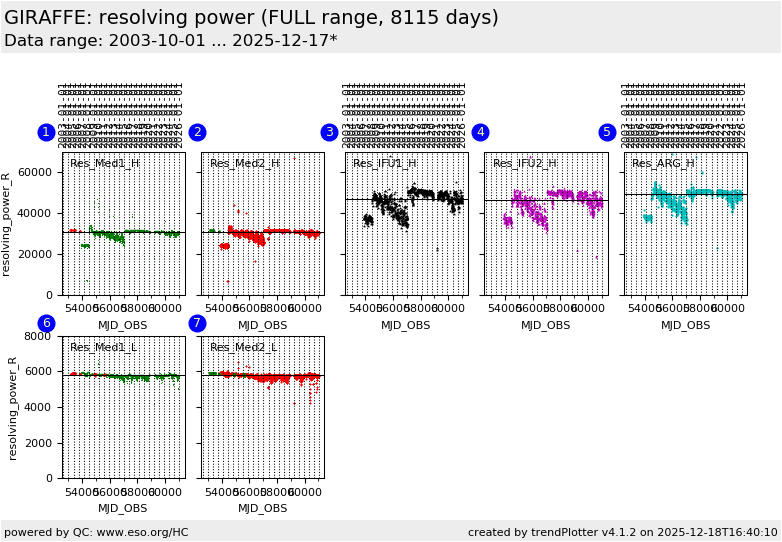
This is the FULL Health Check plot for monitoring the
resolution of the GIRAFFE
arclamp calibration data. We display here the resolving power R =
λ0/Δλ. Δλ is the QC1
parameter mean_resol
which is the mean of all accepted emission line widths. The reference values
for the GIRAFFE resolution are indicated as red broken lines (taken from the
User Manual).
Corresponding data from the GIRAFFE master calibration (re)processing project are available for the Medusa plots and marked separately.
Note that these indicate that the corresponding data calculated between
2006-07-01 and 2008-01-01 have a systematic offset that is not real, due to
some pipeline bug.
This plot monitors the
HC data taken in high resolution (H525.8B) and low resolution (L543.1, Medusa1
and 2 only).
Up to 2008-01, these numbers were approximate. With
pipeline version giraf-2.5 and higher (after that date) accurate numbers were provided. Only these ones should be taken
for reference.
General information
Click on any of the plots to see a close-up version.
The latest date is indicated on top of the plot.
If configured,
- data points belonging to the latest date are specially marked
- statistical averages are indicated by a solid line, and thresholds by broken lines
- outliers are marked by a red asterisk. They are defined as data points outside the
threshold lines
- "aliens" (= data points outside the plot Y limits) are marked by a red arrow (↑ or ↓)
- you can download the data for each parameter set if the 'Data downloads' link shows up
|
