Plot
? |
Symb
? |
Source
* |
Average ? |
Thresholds ? |
N_
data |
QC1
parameter |
Data
downloads |
Remarks |
| method |
value |
unit |
method |
value |
| 1 |
• | QC1DB |
none |
|
ADU |
none | |
6828 |
median_master |
all (full time range)
| median BIAS level
standard dataset median_master1 from QC processing |
| 1 |
• | QC1DB |
none |
|
ADU |
none | |
653 |
median_master |
all (full time range)
| blue dataset median_master2 from GIRAF_M reprocessing project |
| 2 |
• | QC1DB |
MEDIAN |
3.87 |
e- |
VAL | 3.5,4.3 |
6829 |
sigma_raw |
all (full time range)
| RON in single raw frame
[! downloaded data come in ADU (=e-/2.25)] |
| 2 |
• | QC1DB |
none |
|
e- |
none | |
653 |
sigma_raw |
all (full time range)
| from reprocessing |
| 3 |
• | QC1DB |
MEDIAN |
2.15 |
e- |
VAL | 1.95,2.40 |
6828 |
sigma_master |
all (full time range)
| RON in master frame
[! downloaded data come in ADU (=e-/2.25)] |
| 3 |
• | QC1DB |
none |
|
e- |
none | |
653 |
sigma_master |
all (full time range)
| from reprocessing |
| 4 |
x | QC1DB |
MEDIAN |
0.077 |
ADU |
VAL | 0.05,0.12 |
6828 |
struct_row |
all (full time range)
| structure of master in X direction |
| 4 |
x | QC1DB |
none |
|
ADU |
none | |
653 |
struct_row |
all (full time range)
| from reprocessing |
| 5 |
x | QC1DB |
none |
|
ADU |
none | |
6828 |
struct_col |
all (full time range)
| structure of master in Y direction |
| 5 |
x | QC1DB |
none |
|
ADU |
none | |
653 |
struct_col |
all (full time range)
| from reprocessing |
| 6 |
• | QC1DB |
MEDIAN |
81 |
N |
VAL | 0,1000 |
5796 |
bpm_npix |
all (full time range)
| number of bad pixels (old CCD had a bad column with more than 7000 bad pixels) |
| |
|
*Data sources: QC1DB: QC1 database; LOCAL: local data source
|
Plot 1
scores: not implemented
| | data source: | giraffe_bias
(QC1 database) |
dataset:
(numbers below apply to this dataset) | median_master | • |
| average: | none |
| thresholds: | none |
| N_data plotted: | 6828 |
| [click plot for closeup] |
Plot 2
scores: not implemented
| | data source: | giraffe_bias
(QC1 database) |
dataset:
(numbers below apply to this dataset) | sigma_raw | • |
| median: | 3.87 | e- |
| fixed thresholds: | 3.5...4.3 | e- |
| N_data plotted: | 6829 |
| [click plot for closeup] |
Plot 3
scores: not implemented
| | data source: | giraffe_bias
(QC1 database) |
dataset:
(numbers below apply to this dataset) | sigma_master | • |
| median: | 2.15 | e- |
| fixed thresholds: | 1.95...2.4 | e- |
| N_data plotted: | 6828 |
| [click plot for closeup] |
Plot 4
scores: not implemented
| | data source: | giraffe_bias
(QC1 database) |
dataset:
(numbers below apply to this dataset) | struct_row | x |
| median: | 0.077 | ADU |
| fixed thresholds: | 0.05...0.12 | ADU |
| N_data plotted: | 6828 |
| [click plot for closeup] |
Plot 5
scores: not implemented
| | data source: | giraffe_bias
(QC1 database) |
dataset:
(numbers below apply to this dataset) | struct_col | x |
| average: | none |
| thresholds: | none |
| N_data plotted: | 6828 |
| [click plot for closeup] |
Plot 6
scores: not implemented
| | data source: | giraffe_bias
(QC1 database) |
| dataset: | bpm_npix | • |
| median: | 81 | N |
| fixed thresholds: | 0...1000 | N |
| N_data plotted: | 5796 |
| [click plot for closeup] |
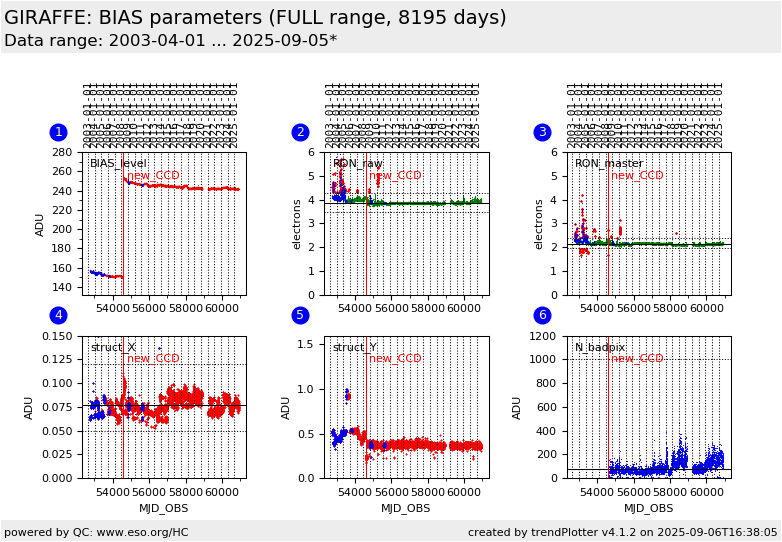
This is the FULL trending plot for the GIRAFFE QC parameters derived from BIAS frames. Only 'normal' readmode
is displayed here.
These plots describe:
1. the BIAS level in masterbias frames,
2. the read noise (RON) of a single raw frame,
3. the read noise (RON) of a master frame,
4. the collapsed structure of a masterbias in X direction,
5. the collapsed structure in Y direction,
6. the number of bad pixels.
The label 'new' refers to the CCD replacement in May 2008.
Corresponding data from the GIRAFFE master calibration (re)processing project are available for the first two years and are marked separately.
Find more information about GIRAFFE BIAS frames
here.
General information
Click on any of the plots to see a close-up version.
The latest date is indicated on top of the plot.
If configured,
- data points belonging to the latest date are specially marked
- statistical averages are indicated by a solid line, and thresholds by broken lines
- outliers are marked by a red asterisk. They are defined as data points outside the
threshold lines
- "aliens" (= data points outside the plot Y limits) are marked by a red arrow (↑ or ↓)
- you can download the data for each parameter set if the 'Data downloads' link shows up
|
