Plot
? |
Symb
? |
Source
* |
Average ? |
Thresholds ? |
N_
data |
QC1
parameter |
Data
downloads |
Remarks |
| method |
value |
unit |
method |
value |
| 1 |
• | QC1DB |
none |
|
e- |
none | |
1170 |
sigma_raw |
all (full time range)
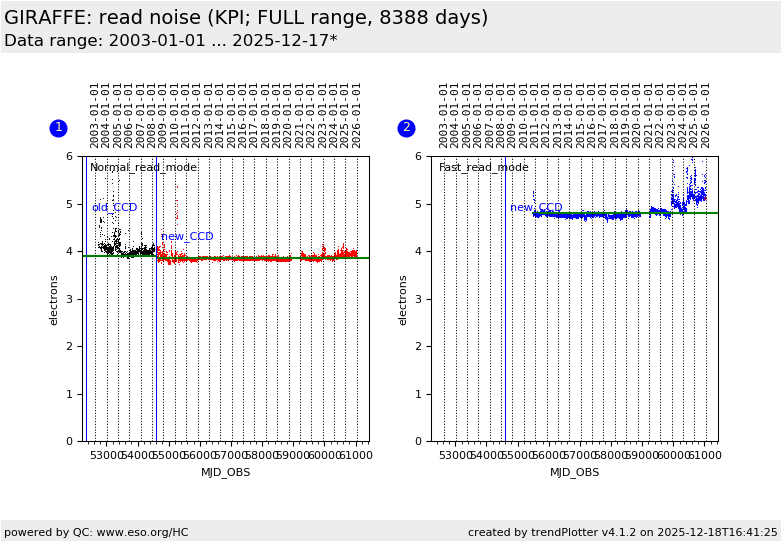
| RON of single raw frame.'Normal' read mode
a) Data for old CCD, until 2008.
[! downloaded data come in ADU (=e-/2.25)] |
| 1 |
• | QC1DB |
none |
|
e- |
none | |
5448 |
sigma_raw |
all (full time range)
| b) Data for current CCD ("new"); reference: 3.9 e-, stable median value; a value of 4.3 e- has been measured on Paranal during commissioning in May 2008
[! downloaded data come in ADU (=e-/2.25)] |
| 2 |
• | QC1DB |
none |
|
e- |
none | |
5093 |
sigma_raw |
all (full time range)
| 'Fast' read mode, current CCD only; reference: 4.8 e-, a value of 5.2 e- has been measured on Paranal during commissioning in May 2008
[! downloaded data come in ADU (=e-/2.4)] |
| |
|
*Data sources: QC1DB: QC1 database; LOCAL: local data source
|
| Plot 1 | | data source: | giraffe_bias
(QC1 database) |
dataset:
(numbers below apply to this dataset) | sigma_raw | • |
| average: | none |
| thresholds: | none |
| N_data plotted: | 1170 |
| (current) reference: | 3.85 |
| [click plot for closeup] |
| Plot 2 | | data source: | giraffe_bias
(QC1 database) |
| dataset: | sigma_raw | • |
| average: | none |
| thresholds: | none |
| N_data plotted: | 5093 |
| (current) reference: | 4.8 |
| [click plot for closeup] |
This is the instrument performance plot for the GIRAFFE read noise. We display
both the 'normal' read mode (used by default and in almost all OBs) and the
'Fast' read mode (monitored regularly but rarely used for science).
The read noise displayed here refers to a single raw frame. We display the
parameter in electrons, while the downloaded data come in ADU.
The label 'new CCD' refers to the current CCD in use since May 2008.
General information
Click on any of the plots to see a close-up version.
The latest date is indicated on top of the plot.
If configured,
- data points belonging to the latest date are specially marked
- statistical averages are indicated by a solid line, and thresholds by broken lines
- outliers are marked by a red asterisk. They are defined as data points outside the
threshold lines
- "aliens" (= data points outside the plot Y limits) are marked by a red arrow (↑ or ↓)
- you can download the data for each parameter set if the 'Data downloads' link shows up
|
