Plot
? |
Symb
? |
Source
* |
Average ? |
Thresholds ? |
N_
data |
QC1
parameter |
Data
downloads |
Remarks |
| method |
value |
unit |
method |
value |
| 1 |
• | QC1DB |
MEDIAN |
2.96e+04 |
N |
VAL | 28000,34000 |
26 |
mean_R |
this |
last_yr |
all
|
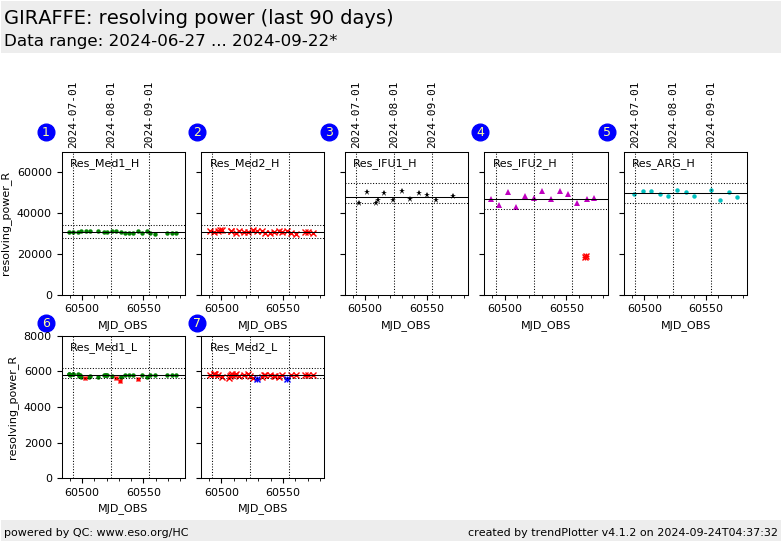
resolving power R (λ0/Δλ) H525.8B, Medusa1 |
| 2 |
x | QC1DB |
MEDIAN |
2.99e+04 |
N |
VAL | 28000,34000 |
26 |
mean_R |
this |
last_yr |
all
|
as plot 1, Medusa2 |
| 3 |
∗ | QC1DB |
MEDIAN |
4.54e+04 |
N |
VAL | 45000,55000 |
12 |
mean_R |
this |
last_yr |
all
|
as plot 1, IFU1 |
| 4 |
▲ | QC1DB |
MEDIAN |
4.48e+04 |
N |
VAL | 42000,55000 |
13 |
mean_R |
this |
last_yr |
all
|
as plot 1, IFU2 |
| 5 |
• | QC1DB |
MEDIAN |
4.74e+04 |
N |
VAL | 45000,55000 |
16 |
mean_R |
this |
last_yr |
all
|
as plot 1, Argus |
| 6 |
• | QC1DB |
MEDIAN |
5.78e+03 |
N |
VAL | 5600,6200 |
34 |
mean_R |
this |
last_yr |
all
|
resolving power R
L543.1, Medusa1 |
| 7 |
x | QC1DB |
MEDIAN |
5.77e+03 |
N |
VAL | 5600,6200 |
30 |
mean_R |
this |
last_yr |
all
|
as plot 6, Medusa2 |
| |
|
*Data sources: QC1DB: QC1 database; LOCAL: local data source
|
Plot 1
scores:  2| 2|
| | data source: | giraffe_wave
(QC1 database) |
| dataset: | mean_R | • |
| median: | 2.96e+04 | N |
| fixed thresholds: | 28000...34000 | N |
| N_data plotted: | 26 |
| [click plot for closeup] |
Plot 2
scores: 2|
| | data source: | giraffe_wave
(QC1 database) |
| dataset: | mean_R | x |
| median: | 2.99e+04 | N |
| fixed thresholds: | 28000...34000 | N |
| N_data plotted: | 26 |
| [click plot for closeup] |
Plot 3
scores:  2| 2|
| | data source: | giraffe_wave
(QC1 database) |
| dataset: | mean_R | ∗ |
| median: | 4.54e+04 | N |
| fixed thresholds: | 45000...55000 | N |
| N_data plotted: | 12 |
| [click plot for closeup] |
Plot 4
scores: 2|
| | data source: | giraffe_wave
(QC1 database) |
| dataset: | mean_R | ▲ |
| median: | 4.48e+04 | N |
| fixed thresholds: | 42000...55000 | N |
| N_data plotted: | 13 |
| [click plot for closeup] |
Plot 5
scores: 1|
| | data source: | giraffe_wave
(QC1 database) |
| dataset: | mean_R | • |
| median: | 4.74e+04 | N |
| fixed thresholds: | 45000...55000 | N |
| N_data plotted: | 16 |
| [click plot for closeup] |
Plot 6
scores: 4|
| | data source: | giraffe_wave
(QC1 database) |
| dataset: | mean_R | • |
| median: | 5.78e+03 | N |
| fixed thresholds: | 5600...6200 | N |
| N_data plotted: | 34 |
| [click plot for closeup] |
Plot 7
scores: 2|
| | data source: | giraffe_wave
(QC1 database) |
| dataset: | mean_R | x |
| median: | 5.77e+03 | N |
| fixed thresholds: | 5600...6200 | N |
| N_data plotted: | 30 |
| [click plot for closeup] |
This is the Health Check plot for monitoring the
resolution of the GIRAFFE
arclamp calibration data. We display here the resolving power R =
λ0/Δλ. Δλ is the QC1
parameter mean_resol
which is the mean of all accepted emission line widths.
This plot monitors the
HC data taken in high resolution (H525.8B) and low resolution (L543.1, Medusa1
and 2 only).
Up to 2008-01, these numbers are approximate. With
pipeline version giraf-2.5 accurate numbers are provided. Only these should be taken
for reference.
Check the RMS plot of this group for the typical rms of the
dispersion solution, and the NLIN plot for the number of accepted lines.
General information
Click on any of the plots to see a close-up version.
The latest date is indicated on top of the plot.
If configured,
- data points belonging to the latest date are specially marked
- statistical averages are indicated by a solid line, and thresholds by broken lines
- outliers are marked by a red asterisk. They are defined as data points outside the
threshold lines
- "aliens" (= data points outside the plot Y limits) are marked by a red arrow (↑ or ↓)
- you can download the data for each parameter set if the 'Data downloads' link shows up
|
