Plot
? |
Symb
? |
Source
* |
Average ? |
Thresholds ? |
N_
data |
QC1
parameter |
Data
downloads |
Remarks |
| method |
value |
unit |
method |
value |
| 5 |
• | QC1DB |
MEDIAN |
10.60261 |
ADU |
3SIG | ± 0.34693 |
149 |
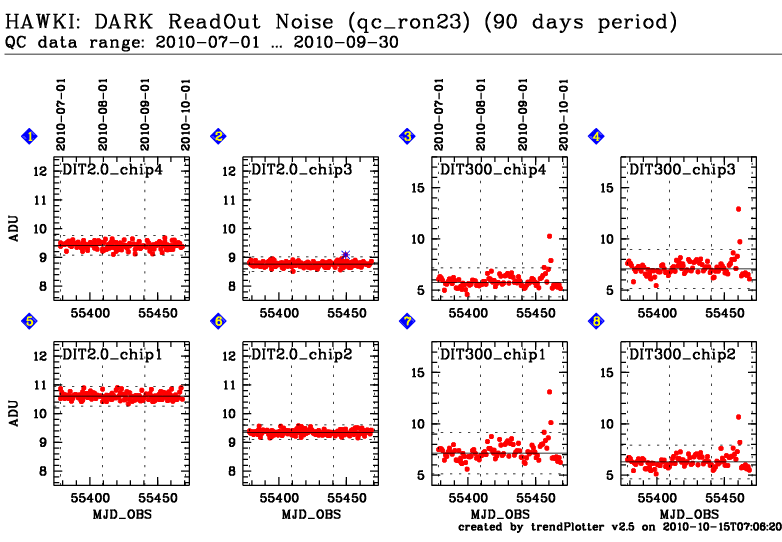
qc_ron23 |
this |
last_yr |
all
|
DARK ReadOut Noise from RAW2 and RAW3, chip 1, DIT=2.0 |
| 6 |
• | QC1DB |
MEDIAN |
9.34728 |
ADU |
3SIG | ± 0.25626 |
149 |
qc_ron23 |
this |
last_yr |
all
|
DARK ReadOut Noise from RAW2 and RAW3, chip 2, DIT=2.0 |
| 2 |
• | QC1DB |
MEDIAN |
8.76774 |
ADU |
3SIG | ± 0.25514 |
149 |
qc_ron23 |
this |
last_yr |
all
|
DARK ReadOut Noise from RAW2 and RAW3, chip 3, DIT=2.0 |
| 1 |
• | QC1DB |
MEDIAN |
9.4212 |
ADU |
3SIG | ± 0.33796 |
149 |
qc_ron23 |
this |
last_yr |
all
|
DARK ReadOut Noise from RAW2 and RAW3, chip 4, DIT=2.0 |
| 7 |
• | QC1DB |
MEDIAN |
7.1461 |
ADU |
3SIG | ± 2.02712 |
96 |
qc_ron23 |
this |
last_yr |
all
|
DARK ReadOut Noise from RAW2 and RAW3, chip 1, DIT=300 |
| 8 |
• | QC1DB |
MEDIAN |
6.27941 |
ADU |
3SIG | ± 1.64013 |
96 |
qc_ron23 |
this |
last_yr |
all
|
DARK ReadOut Noise from RAW2 and RAW3, chip 2, DIT=300 |
| 4 |
• | QC1DB |
MEDIAN |
7.08372 |
ADU |
3SIG | ± 1.89961 |
96 |
qc_ron23 |
this |
last_yr |
all
|
DARK ReadOut Noise from RAW2 and RAW3, chip 3, DIT=300 |
| 3 |
• | QC1DB |
MEDIAN |
5.76668 |
ADU |
3SIG | ± 1.4237 |
96 |
qc_ron23 |
this |
last_yr |
all
|
DARK ReadOut Noise from RAW2 and RAW3, chip 4, DIT=300 |
| |
|
*Data sources: QC1DB: QC1 database; LOCAL: local text file
|
| Plot 5 | | data source: | hawki_dark
(QC1 database) |
| parameter | dataset: | qc_ron23 | • |
| median: | 10.60261 | ADU |
| rel. thresholds: 3σ | 10.25568...10.94954 | ADU |
| N_data: | 149 |
| [click on plot for closeup] |

| Plot 6 | | data source: | hawki_dark
(QC1 database) |
| parameter | dataset: | qc_ron23 | • |
| median: | 9.34728 | ADU |
| rel. thresholds: 3σ | 9.09102...9.60353 | ADU |
| N_data: | 149 |
| [click on plot for closeup] |

| Plot 2 | | data source: | hawki_dark
(QC1 database) |
| parameter | dataset: | qc_ron23 | • |
| median: | 8.76774 | ADU |
| rel. thresholds: 3σ | 8.5126...9.02287 | ADU |
| N_data: | 149 |
| [click on plot for closeup] |

| Plot 1 | | data source: | hawki_dark
(QC1 database) |
| parameter | dataset: | qc_ron23 | • |
| median: | 9.4212 | ADU |
| rel. thresholds: 3σ | 9.08323...9.75916 | ADU |
| N_data: | 149 |
| [click on plot for closeup] |

| Plot 7 | | data source: | hawki_dark
(QC1 database) |
| parameter | dataset: | qc_ron23 | • |
| median: | 7.1461 | ADU |
| rel. thresholds: 3σ | 5.11898...9.17323 | ADU |
| N_data: | 96 |
| [click on plot for closeup] |

| Plot 8 | | data source: | hawki_dark
(QC1 database) |
| parameter | dataset: | qc_ron23 | • |
| median: | 6.27941 | ADU |
| rel. thresholds: 3σ | 4.63929...7.91954 | ADU |
| N_data: | 96 |
| [click on plot for closeup] |

| Plot 4 | | data source: | hawki_dark
(QC1 database) |
| parameter | dataset: | qc_ron23 | • |
| median: | 7.08372 | ADU |
| rel. thresholds: 3σ | 5.18411...8.98333 | ADU |
| N_data: | 96 |
| [click on plot for closeup] |

| Plot 3 | | data source: | hawki_dark
(QC1 database) |
| parameter | dataset: | qc_ron23 | • |
| median: | 5.76668 | ADU |
| rel. thresholds: 3σ | 4.34298...7.19039 | ADU |
| N_data: | 96 |
| [click on plot for closeup] |

Click on any of the plots to see a close-up version.
The latest date is indicated on top of the plot, data points belonging to that date are specially marked.
If configured,
- statistical averages are indicated by a solid line, and thresholds by broken lines
- outliers are marked by a red asterisk. They are defined as data points outside the
threshold lines
- "aliens" (= data points outside the plot Y limits) are marked by a red arrow (↑ or ↓)
- you can download the data for each parameter set if the 'Data downloads' link shows up
|
