Plot
? |
Symb
? |
Source
* |
Average ? |
Thresholds ? |
N_
data |
QC1
parameter |
Data
downloads |
Remarks |
| method |
value |
unit |
method |
value |
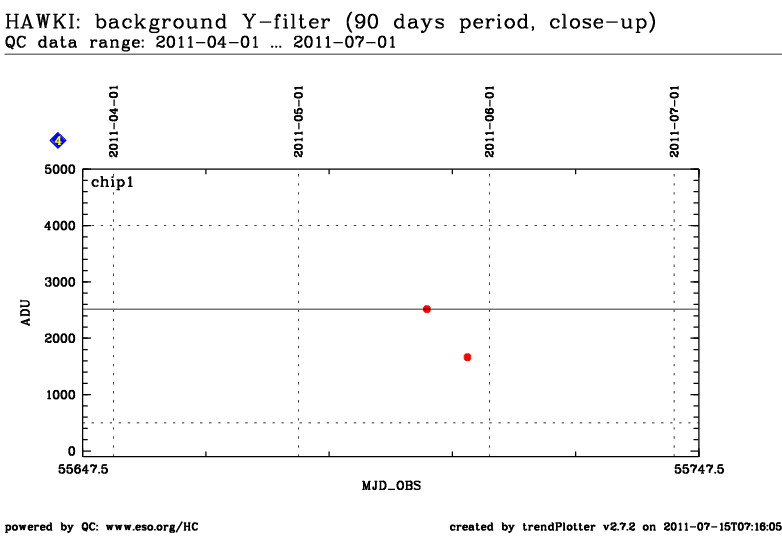
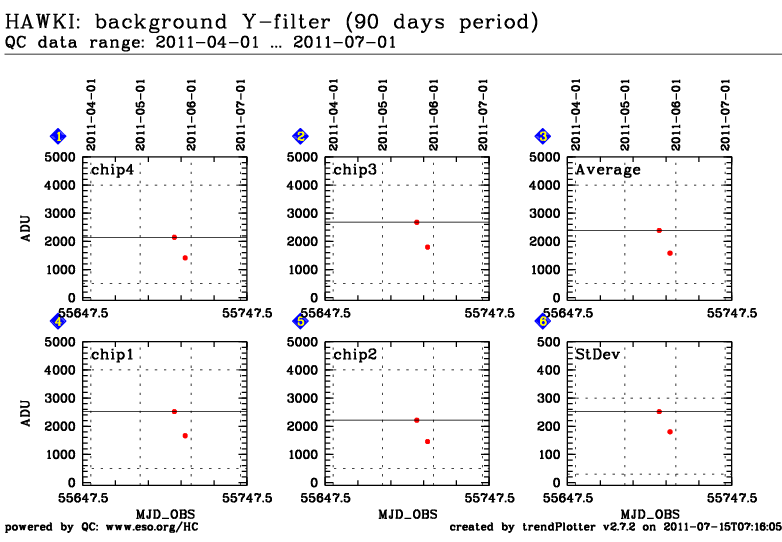
| 4 |
• | QC1DB |
MEDIAN |
2516.94971 |
ADU |
VAL | 500,4000 |
2 |
qc_backgd_mean |
this |
last_yr |
all
|
background, chip 1 |
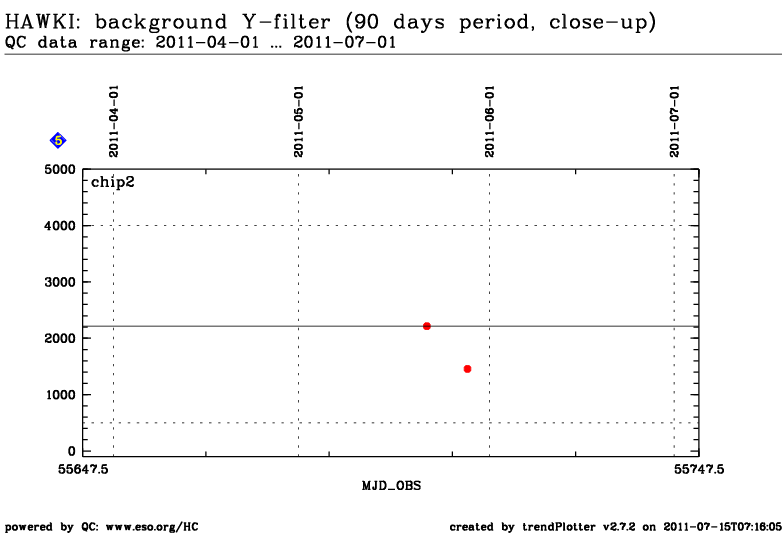
| 5 |
• | QC1DB |
MEDIAN |
2214.60913 |
ADU |
VAL | 500,4000 |
2 |
qc_backgd_mean |
this |
last_yr |
all
|
background, chip 2 |
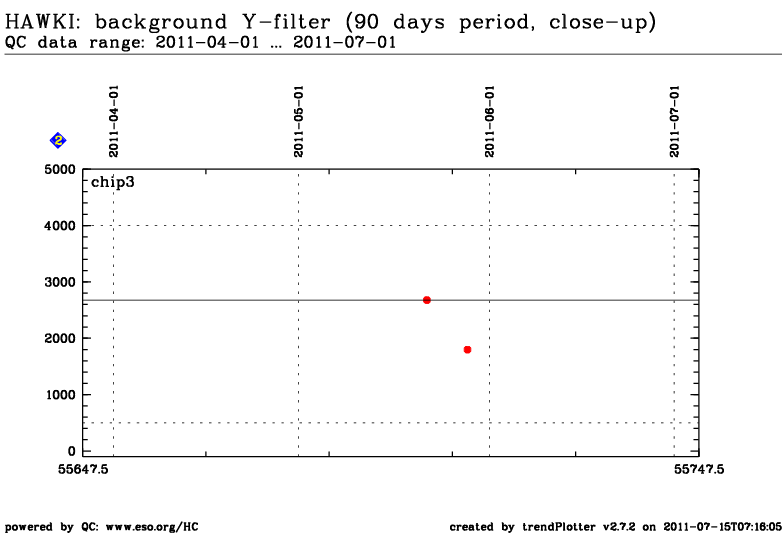
| 2 |
• | QC1DB |
MEDIAN |
2678.18188 |
ADU |
VAL | 500,4000 |
2 |
qc_backgd_mean |
this |
last_yr |
all
|
background, chip 3 |
| 1 |
• | QC1DB |
MEDIAN |
2144.57959 |
ADU |
VAL | 500,4000 |
2 |
qc_backgd_mean |
this |
last_yr |
all
|
background, chip 4 |
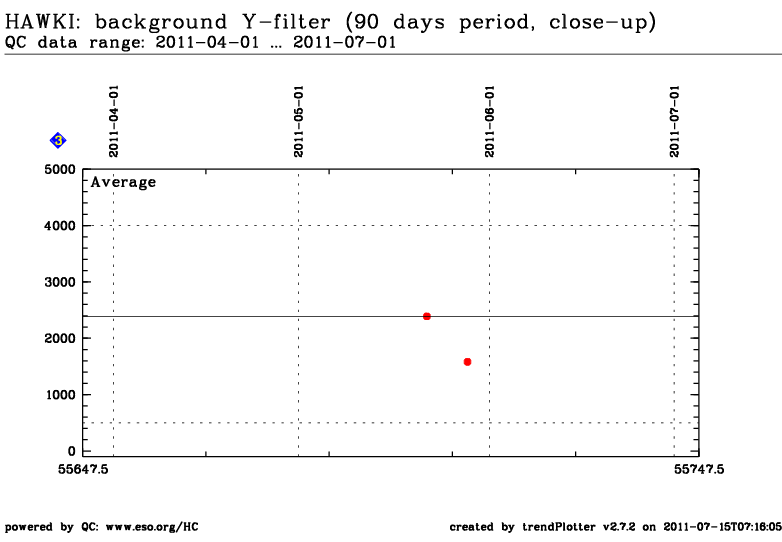
| 3 |
• | QC1DB |
MEDIAN |
2388.58008 |
ADU |
VAL | 500,4000 |
2 |
qc_backgd_mean |
this |
last_yr |
all
|
Means of the background of the four chips |
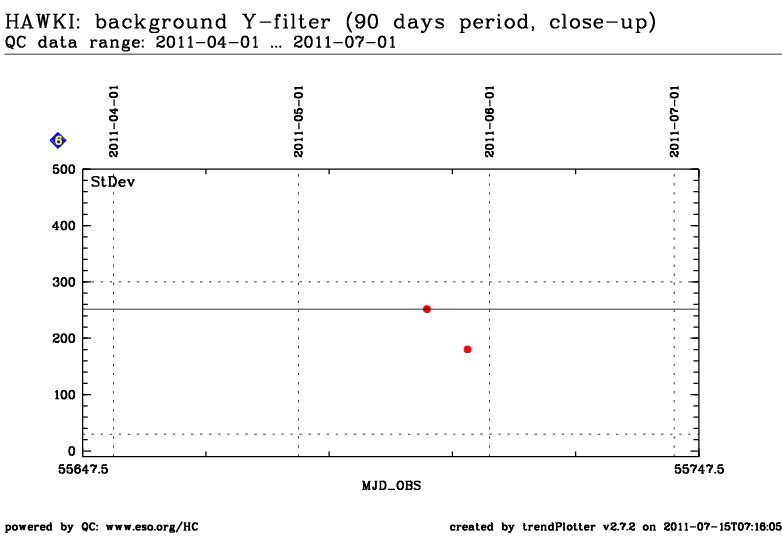
| 6 |
• | QC1DB |
MEDIAN |
251.761 |
ADU |
VAL | 30,300 |
2 |
qc_backgd_mean |
this |
last_yr |
all
|
Standard deviations of the measured background of the four chips |
| |
|
*Data sources: QC1DB: QC1 database; LOCAL: local text file
|
| Plot 4 | | data source: | hawki_science
(QC1 database) |
| parameter | dataset: | qc_backgd_mean | • |
| median: | 2516.94971 | ADU |
| fixed thresholds: | 500.0...4000.0 | ADU |
| N_data: | 2 |
| [click on plot for closeup] |
| Plot 5 | | data source: | hawki_science
(QC1 database) |
| parameter | dataset: | qc_backgd_mean | • |
| median: | 2214.60913 | ADU |
| fixed thresholds: | 500.0...4000.0 | ADU |
| N_data: | 2 |
| [click on plot for closeup] |
| Plot 2 | | data source: | hawki_science
(QC1 database) |
| parameter | dataset: | qc_backgd_mean | • |
| median: | 2678.18188 | ADU |
| fixed thresholds: | 500.0...4000.0 | ADU |
| N_data: | 2 |
| [click on plot for closeup] |
| Plot 1 | | data source: | hawki_science
(QC1 database) |
| parameter | dataset: | qc_backgd_mean | • |
| median: | 2144.57959 | ADU |
| fixed thresholds: | 500.0...4000.0 | ADU |
| N_data: | 2 |
| [click on plot for closeup] |

| Plot 3 | | data source: | hawki_science
(QC1 database) |
| parameter | dataset: | qc_backgd_mean | • |
| median: | 2388.58008 | ADU |
| fixed thresholds: | 500.0...4000.0 | ADU |
| N_data: | 2 |
| [click on plot for closeup] |
| Plot 6 | | data source: | hawki_science
(QC1 database) |
| parameter | dataset: | qc_backgd_mean | • |
| median: | 251.761 | ADU |
| fixed thresholds: | 30.0...300.0 | ADU |
| N_data: | 2 |
| [click on plot for closeup] |
[an error occurred while processing this directive]
General information
Click on any of the plots to see a close-up version.
The latest date is indicated on top of the plot, data points belonging to that date are specially marked.
If configured,
- statistical averages are indicated by a solid line, and thresholds by broken lines
- outliers are marked by a red asterisk. They are defined as data points outside the
threshold lines
- "aliens" (= data points outside the plot Y limits) are marked by a red arrow (↑ or ↓)
- you can download the data for each parameter set if the 'Data downloads' link shows up
|
