|
|
| HAWKI trending system: HISTORY report |
|
|
|
Last update: 2013-07-15T07:01:22 (UT)
|
|
|
*Date on this monitor changes at 21:00 UT |
|

|
|
|
Plot
? |
Symb
? |
Source
* |
Average ? |
Thresholds ? |
N_
data |
QC1
parameter |
Data
downloads |
Remarks |
| method |
value |
unit |
method |
value |
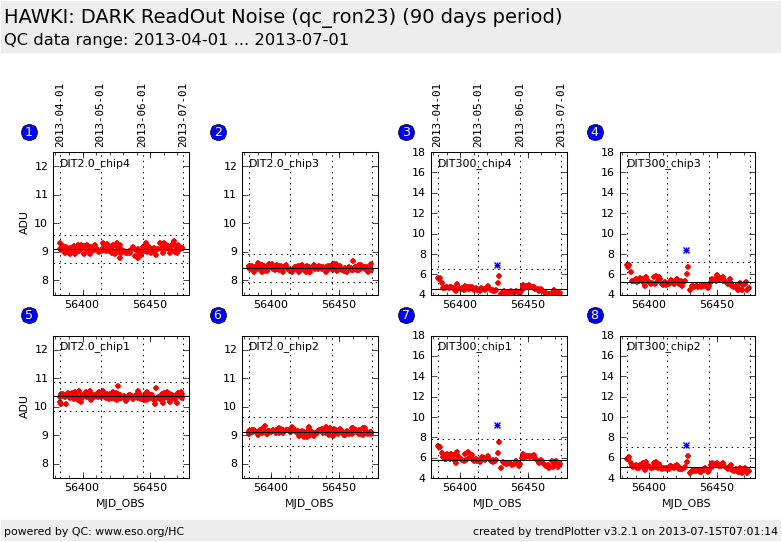
| 1 |
• | QC1DB |
MEDIAN |
9.1 |
ADU |
OFF | ± 0.5 |
134 |
qc_ron23 |
this |
last_yr |
all
|
DARK ReadOut Noise from RAW2 and RAW3, chip 4, DIT=2.0 |
| 2 |
• | QC1DB |
MEDIAN |
8.44 |
ADU |
OFF | ± 0.5 |
134 |
qc_ron23 |
this |
last_yr |
all
|
DARK ReadOut Noise from RAW2 and RAW3, chip 3, DIT=2.0 |
| 3 |
• | QC1DB |
MEDIAN |
4.55 |
ADU |
OFF | ± 2.0 |
97 |
qc_ron23 |
this |
last_yr |
all
|
DARK ReadOut Noise from RAW2 and RAW3, chip 4, DIT=300 |
| 4 |
• | QC1DB |
MEDIAN |
5.26 |
ADU |
OFF | ± 2.0 |
97 |
qc_ron23 |
this |
last_yr |
all
|
DARK ReadOut Noise from RAW2 and RAW3, chip 3, DIT=300 |
| 5 |
• | QC1DB |
MEDIAN |
10.4 |
ADU |
OFF | ± 0.5 |
134 |
qc_ron23 |
this |
last_yr |
all
|
DARK ReadOut Noise from RAW2 and RAW3, chip 1, DIT=2.0 |
| 6 |
• | QC1DB |
MEDIAN |
9.13 |
ADU |
OFF | ± 0.5 |
134 |
qc_ron23 |
this |
last_yr |
all
|
DARK ReadOut Noise from RAW2 and RAW3, chip 2, DIT=2.0 |
| 7 |
• | QC1DB |
MEDIAN |
5.82 |
ADU |
OFF | ± 2.0 |
97 |
qc_ron23 |
this |
last_yr |
all
|
DARK ReadOut Noise from RAW2 and RAW3, chip 1, DIT=300 |
| 8 |
• | QC1DB |
MEDIAN |
5.06 |
ADU |
OFF | ± 2.0 |
97 |
qc_ron23 |
this |
last_yr |
all
|
DARK ReadOut Noise from RAW2 and RAW3, chip 2, DIT=300 |
| |
|
*Data sources: QC1DB: QC1 database; LOCAL: local text file
|
| Plot 5 | | data source: | hawki_dark
(QC1 database) |
| dataset: | qc_ron23 | • |
| median: | 10.4 | ADU |
| rel. thresholds: | 9.870534...10.870534 | ADU |
| N_data plotted: | 134 |
| [click on plot for closeup] |
| Plot 6 | | data source: | hawki_dark
(QC1 database) |
| dataset: | qc_ron23 | • |
| median: | 9.13 | ADU |
| rel. thresholds: | 8.627766...9.627766 | ADU |
| N_data plotted: | 134 |
| [click on plot for closeup] |
| Plot 2 | | data source: | hawki_dark
(QC1 database) |
| dataset: | qc_ron23 | • |
| median: | 8.44 | ADU |
| rel. thresholds: | 7.935468...8.935468 | ADU |
| N_data plotted: | 134 |
| [click on plot for closeup] |
| Plot 1 | | data source: | hawki_dark
(QC1 database) |
| dataset: | qc_ron23 | • |
| median: | 9.1 | ADU |
| rel. thresholds: | 8.6005085...9.6005085 | ADU |
| N_data plotted: | 134 |
| [click on plot for closeup] |
| Plot 7 | | data source: | hawki_dark
(QC1 database) |
| dataset: | qc_ron23 | • |
| median: | 5.82 | ADU |
| rel. thresholds: | 3.8191905...7.8191905 | ADU |
| N_data plotted: | 97 |
| [click on plot for closeup] |
| Plot 8 | | data source: | hawki_dark
(QC1 database) |
| dataset: | qc_ron23 | • |
| median: | 5.06 | ADU |
| rel. thresholds: | 3.0561155...7.0561155 | ADU |
| N_data plotted: | 97 |
| [click on plot for closeup] |
| Plot 4 | | data source: | hawki_dark
(QC1 database) |
| dataset: | qc_ron23 | • |
| median: | 5.26 | ADU |
| rel. thresholds: | 3.257255...7.257255 | ADU |
| N_data plotted: | 97 |
| [click on plot for closeup] |
| Plot 3 | | data source: | hawki_dark
(QC1 database) |
| dataset: | qc_ron23 | • |
| median: | 4.55 | ADU |
| rel. thresholds: | 2.548848...6.548848 | ADU |
| N_data plotted: | 97 |
| [click on plot for closeup] |
Click on any of the plots to see a close-up version.
The latest date is indicated on top of the plot, data points belonging to that date are specially marked.
If configured,
- statistical averages are indicated by a solid line, and thresholds by broken lines
- outliers are marked by a red asterisk. They are defined as data points outside the
threshold lines
- "aliens" (= data points outside the plot Y limits) are marked by a red arrow (↑ or ↓)
- you can download the data for each parameter set if the 'Data downloads' link shows up
|
|