|
|
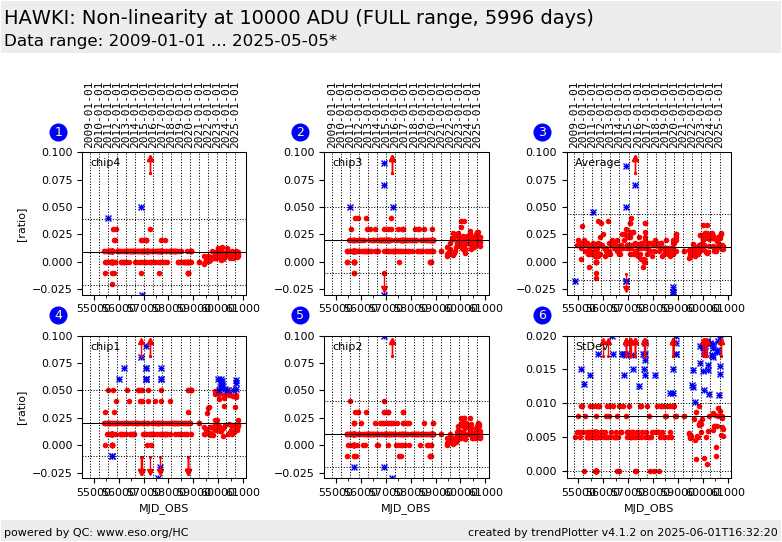
| HAWKI trending system: FULL report |
|
|
| Last update: 2019-12-06T16:32:44 (UT)
|
|
|

|
|
|
Plot
? |
Symb
? |
Source
* |
Average ? |
Thresholds ? |
N_
data |
QC1
parameter |
Data
downloads |
Remarks |
| method |
value |
unit |
method |
value |
| 1 |
• | QC1DB |
MEDIAN |
0.01 |
ADU |
OFF | ± 0.03 |
177 |
qc_lin_eff |
all (full time range)
| detector non-linearity at 10000 ADU, chip 4 |
| 2 |
• | QC1DB |
MEDIAN |
0.02 |
ADU |
OFF | ± 0.03 |
177 |
qc_lin_eff |
all (full time range)
| detector non-linearity at 10000 ADU, chip 3 |
| 3 |
• | QC1DB |
MEDIAN |
0.0125 |
ADU |
OFF | ± 0.03 |
191 |
qc_lin_eff |
all (full time range)
| Means of the non-linearity at 10000 ADU of the four chips |
| 4 |
• | QC1DB |
MEDIAN |
0.02 |
ADU |
OFF | ± 0.03 |
177 |
qc_lin_eff |
all (full time range)
| detector non-linearity at 10000 ADU, chip 1 |
| 5 |
• | QC1DB |
MEDIAN |
0.01 |
ADU |
OFF | ± 0.03 |
176 |
qc_lin_eff |
all (full time range)
| detector non-linearity at 10000 ADU, chip 2 |
| 6 |
• | QC1DB |
MEDIAN |
0.00577 |
ADU |
VAL | 0.00,0.01 |
191 |
qc_lin_eff |
all (full time range)
| Standard deviations of the measured non-linearity at 10000 ADU of the four chips |
| |
|
*Data sources: QC1DB: QC1 database; LOCAL: local data source
|
Plot 4
scores: | | data source: | hawki_detlin
(QC1 database) |
| dataset: | qc_lin_eff | • |
| median: | 0.02 | ADU |
| rel. thresholds: | -0.01...0.05 | ADU |
| N_data plotted: | 177 |
| [click plot for closeup] |
Plot 5
scores: | | data source: | hawki_detlin
(QC1 database) |
| dataset: | qc_lin_eff | • |
| median: | 0.01 | ADU |
| rel. thresholds: | -0.02...0.04 | ADU |
| N_data plotted: | 176 |
| [click plot for closeup] |
Plot 2
scores: | | data source: | hawki_detlin
(QC1 database) |
| dataset: | qc_lin_eff | • |
| median: | 0.02 | ADU |
| rel. thresholds: | -0.01...0.05 | ADU |
| N_data plotted: | 177 |
| [click plot for closeup] |
Plot 1
scores: | | data source: | hawki_detlin
(QC1 database) |
| dataset: | qc_lin_eff | • |
| median: | 0.01 | ADU |
| rel. thresholds: | -0.02...0.04 | ADU |
| N_data plotted: | 177 |
| [click plot for closeup] |
Plot 3
scores: | | data source: | hawki_detlin
(QC1 database) |
| dataset: | qc_lin_eff | • |
| median: | 0.0125 | ADU |
| rel. thresholds: | -0.0175...0.0425 | ADU |
| N_data plotted: | 191 |
| [click plot for closeup] |
Plot 6
scores: | | data source: | hawki_detlin
(QC1 database) |
| dataset: | qc_lin_eff | • |
| median: | 0.00577 | ADU |
| fixed thresholds: | 0.0...0.01 | ADU |
| N_data plotted: | 191 |
| [click plot for closeup] |
General information
Click on any of the plots to see a close-up version.
The latest date is indicated on top of the plot.
If configured,
- data points belonging to the latest date are specially marked
- statistical averages are indicated by a solid line, and thresholds by broken lines
- outliers are marked by a red asterisk. They are defined as data points outside the
threshold lines
- "aliens" (= data points outside the plot Y limits) are marked by a red arrow (↑ or ↓)
- you can download the data for each parameter set if the 'Data downloads' link shows up
|
|