Plot
? |
Symb
? |
Source
* |
OPS?
** |
Average ? |
Thresholds ? |
N_
data |
QC1
parameter |
Data
downloads |
Remarks |
| method |
value |
unit |
method |
value |
| 1 |
• | QC1DB |
yes (0) |
MEDIAN |
|
ADU |
10% | |
0 |
qc_dark_med |
this |
last_yr |
all
|
median dark level, chip 4, DIT=1.2572 |
| 2 |
• | QC1DB |
yes (0) |
MEDIAN |
|
ADU |
10% | |
0 |
qc_dark_med |
this |
last_yr |
all
|
median dark level, chip 3, DIT=1.2572 |
| 3 |
• | QC1DB |
yes (0) |
MEDIAN |
8.9 |
ADU |
10% | ± 0.89 |
167 |
qc_dark_med |
this |
last_yr |
all
|
median dark level, chip 4, DIT=60.0 |
| 4 |
• | QC1DB |
yes (0) |
MEDIAN |
11.1 |
ADU |
10% | ± 1.11 |
167 |
qc_dark_med |
this |
last_yr |
all
|
median dark level, chip 3, DIT=60.0 |
| 5 |
• | QC1DB |
yes (0) |
MEDIAN |
|
ADU |
10% | |
0 |
qc_dark_med |
this |
last_yr |
all
|
median dark level, chip 1, DIT=1.2572 |
| 6 |
• | QC1DB |
yes (0) |
MEDIAN |
|
ADU |
10% | |
0 |
qc_dark_med |
this |
last_yr |
all
|
median dark level, chip 2, DIT=1.2572 |
| 7 |
• | QC1DB |
yes (0) |
MEDIAN |
12.9 |
ADU |
10% | ± 1.29 |
168 |
qc_dark_med |
this |
last_yr |
all
|
median dark level, chip 1, DIT=60.0 |
| 8 |
• | QC1DB |
yes (0) |
MEDIAN |
8.06 |
ADU |
10% | ± 0.806 |
168 |
qc_dark_med |
this |
last_yr |
all
|
median dark level, chip 2, DIT=60.0 |
| |
|
*Data sources: QC1DB: QC1 database; LOCAL: local text file | **OPS: OPSLOG data are included
|
Plot 5
scores: not implemented
| | data source: | hawki_dark
(QC1 database) |
| dataset: | qc_dark_med | • |
| median: | no data | ADU |
| thresholds: | none | |
| N_data plotted: | 0 |
| [click on plot for closeup] |
Plot 6
scores: not implemented
| | data source: | hawki_dark
(QC1 database) |
| dataset: | qc_dark_med | • |
| median: | no data | ADU |
| thresholds: | none | |
| N_data plotted: | 0 |
| [click on plot for closeup] |
Plot 2
scores: not implemented
| | data source: | hawki_dark
(QC1 database) |
| dataset: | qc_dark_med | • |
| median: | no data | ADU |
| thresholds: | none | |
| N_data plotted: | 0 |
| [click on plot for closeup] |
Plot 1
scores: not implemented
| | data source: | hawki_dark
(QC1 database) |
| dataset: | qc_dark_med | • |
| median: | no data | ADU |
| thresholds: | none | |
| N_data plotted: | 0 |
| [click on plot for closeup] |
Plot 7
scores: not implemented
| | data source: | hawki_dark
(QC1 database) |
| dataset: | qc_dark_med | • |
| median: | 12.9 | ADU |
| rel. thresholds: ±10% | 11.5817229...14.1554391 | ADU |
| N_data plotted: | 168 |
| [click on plot for closeup] |
Plot 8
scores: not implemented
| | data source: | hawki_dark
(QC1 database) |
| dataset: | qc_dark_med | • |
| median: | 8.06 | ADU |
| rel. thresholds: ±10% | 7.2575676...8.8703604 | ADU |
| N_data plotted: | 168 |
| [click on plot for closeup] |
Plot 4
scores: not implemented
| | data source: | hawki_dark
(QC1 database) |
| dataset: | qc_dark_med | • |
| median: | 11.1 | ADU |
| rel. thresholds: ±10% | 10.0132092...12.2383668 | ADU |
| N_data plotted: | 167 |
| [click on plot for closeup] |
Plot 3
scores: not implemented
| | data source: | hawki_dark
(QC1 database) |
| dataset: | qc_dark_med | • |
| median: | 8.9 | ADU |
| rel. thresholds: ±10% | 8.0060472...9.7851688 | ADU |
| N_data plotted: | 167 |
| [click on plot for closeup] |
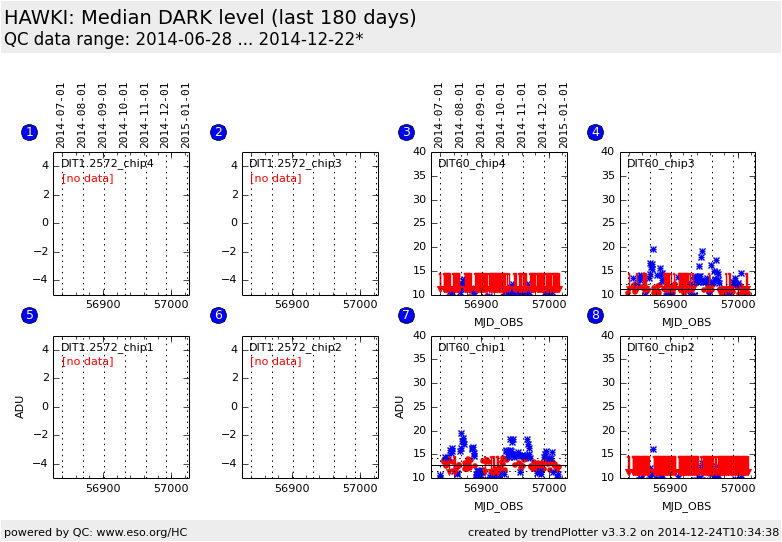
Trending report for median value across master dark.
QC parameter is derived for each detector of the raw dark frames.
On 2016-11-19 (blue vertical line) new CASU pipeline was adopted.
Name:
Fits header: QC.RAW.MEDIAN.MEAN,
QC1 DB: qc_dark_med
Description:
The mean of the raw dark medians.
Setup:
DET.DIT=2.0
DET.DIT=300.0
These plots describe:
Fig. 1. chip4: The QC parameter for DIT=2.0 for chip #4.
Fig. 2. chip3: The QC parameter for DIT=2.0 for chip #3.
Fig. 3. chip4: The QC parameter for DIT=300.0 for chip #4.
Fig. 4. chip3: The QC parameter for DIT=300.0 for chip #3.
Fig. 5. chip1: The QC parameter for DIT=2.0 for chip #1.
Fig. 6. chip2: The QC parameter for DIT=2.0 for chip #2.
Fig. 7. chip1: The QC parameter for DIT=300.0 for chip #1.
Fig. 8. chip2: The QC parameter for DIT=300.0 for chip #2.
Find more information on the HAWKI DARK calibration tutorial page.
General information
Click on any of the plots to see a close-up version.
If applicable, the latest values from Paranal ops logs are plotted as blue dots. More information about those values, including a download option, is available in the OPS column.
The latest date is indicated on top of the plot, data points belonging to that date are specially marked.
If configured,
- statistical averages are indicated by a solid line, and thresholds by broken lines
- outliers are marked by a red asterisk. They are defined as data points outside the
threshold lines
- "aliens" (= data points outside the plot Y limits) are marked by a red arrow (↑ or ↓)
- you can download the data for each parameter set if the 'Data downloads' link shows up
|

