[an error occurred while processing this directive]
HAWKI trending system: HEALTH CHECK report
Last update: 2014-12-24T10:35:11 (UT)
[enable javascript for displaying time difference!]
General news:
NOTE: The Health Check and calChecker services have been moved to qcFlow. These pages are only maintained for comparison
and will be removed in 2026.
HAWKI news:
Report news:
Plot? Symb? Source OPS? Average ? Thresholds ? N_ QC1 Data Remarks
method value unit method value
1
• QC1DB yes (0) MEDIAN 9.17 ADU OFF ± 0.5 119 qc_ron12
this |
last_yr |
all
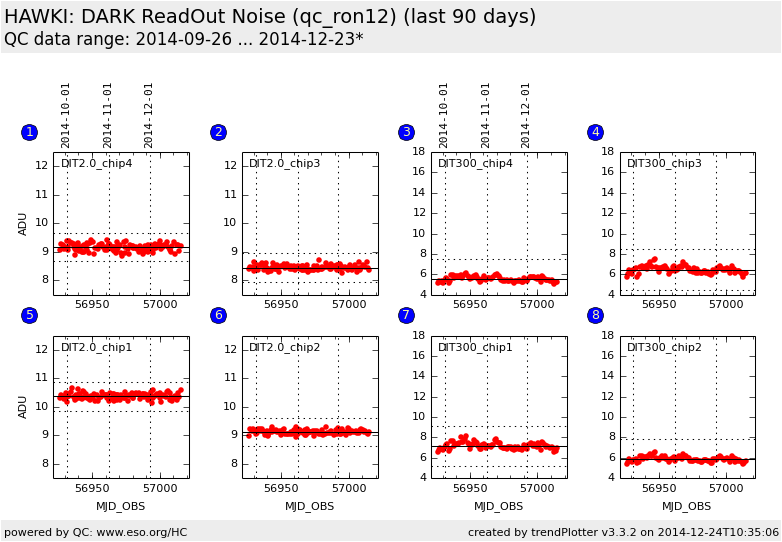
DARK ReadOut Noise from RAW1 and RAW2, chip 4, DIT=2.0
2
• QC1DB yes (0) MEDIAN 8.45 ADU OFF ± 0.5 119 qc_ron12
this |
last_yr |
all
DARK ReadOut Noise from RAW1 and RAW2, chip 3, DIT=2.0
3
• QC1DB yes (0) MEDIAN 5.54 ADU OFF ± 2.0 89 qc_ron12
this |
last_yr |
all
DARK ReadOut Noise from RAW1 and RAW2, chip 4, DIT=300
4
• QC1DB yes (0) MEDIAN 6.45 ADU OFF ± 2.0 89 qc_ron12
this |
last_yr |
all
DARK ReadOut Noise from RAW1 and RAW2, chip 3, DIT=300
5
• QC1DB yes (0) MEDIAN 10.4 ADU OFF ± 0.5 119 qc_ron12
this |
last_yr |
all
DARK ReadOut Noise from RAW1 and RAW2, chip 1, DIT=2.0
6
• QC1DB yes (0) MEDIAN 9.13 ADU OFF ± 0.5 117 qc_ron12
this |
last_yr |
all
DARK ReadOut Noise from RAW1 and RAW2, chip 2, DIT=2.0
7
• QC1DB yes (0) MEDIAN 7.15 ADU OFF ± 2.0 89 qc_ron12
this |
last_yr |
all
DARK ReadOut Noise from RAW1 and RAW2, chip 1, DIT=300
8
• QC1DB yes (0) MEDIAN 5.87 ADU OFF ± 2.0 89 qc_ron12
this |
last_yr |
all
DARK ReadOut Noise from RAW1 and RAW2, chip 2, DIT=300
*Data sources: QC1DB: QC1 database; LOCAL: local text file | **OPS: OPSLOG data are included
Plot 5 scores: not implemented
data source: hawki_dark dataset: qc_ron12 • median: 10.4 ADU rel. thresholds: 9.863485...10.863485 ADU N_data plotted: 119 [click on plot for closeup]
Plot 6 scores: not implemented
data source: hawki_dark dataset: qc_ron12 • median: 9.13 ADU rel. thresholds: 8.625462...9.625462 ADU N_data plotted: 117 [click on plot for closeup]
Plot 2 scores: not implemented
data source: hawki_dark dataset: qc_ron12 • median: 8.45 ADU rel. thresholds: 7.94839...8.94839 ADU N_data plotted: 119 [click on plot for closeup]
Plot 1 scores: not implemented
data source: hawki_dark dataset: qc_ron12 • median: 9.17 ADU rel. thresholds: 8.670993...9.670993 ADU N_data plotted: 119 [click on plot for closeup]
Plot 7 scores: not implemented
data source: hawki_dark dataset: qc_ron12 • median: 7.15 ADU rel. thresholds: 5.146542...9.146542 ADU N_data plotted: 89 [click on plot for closeup]
Plot 8 scores: not implemented
data source: hawki_dark dataset: qc_ron12 • median: 5.87 ADU rel. thresholds: 3.866478...7.866478 ADU N_data plotted: 89 [click on plot for closeup]
Plot 4 scores: not implemented
data source: hawki_dark dataset: qc_ron12 • median: 6.45 ADU rel. thresholds: 4.447897...8.447897 ADU N_data plotted: 89 [click on plot for closeup]
Plot 3 scores: not implemented
data source: hawki_dark dataset: qc_ron12 • median: 5.54 ADU rel. thresholds: 3.538442...7.538442 ADU N_data plotted: 89 [click on plot for closeup]
General information
Click on any of the plots to see a close-up version .
If applicable, the latest values from Paranal ops logs are plotted as blue dots. More information about those values, including a download option, is available in the OPS column.
The latest date is indicated on top of the plot, data points belonging to that date are specially marked.
If configured,
statistical averages are indicated by a solid line, and thresholds by broken lines outliers are marked by a red asterisk. They are defined as data points outside the
threshold lines "aliens" (= data points outside the plot Y limits) are marked by a red arrow (↑ ↓ you can download the data for each parameter set if the 'Data downloads' link shows up

