Plot
? |
Symb
? |
Source
* |
Average ? |
Thresholds ? |
N_
data |
QC1
parameter |
Data
downloads |
Remarks |
| method |
value |
unit |
method |
value |
| 1 |
• | QC1DB |
MEDIAN |
510.00003 |
PIXEL |
VAL | 505,513 |
15 |
qc_slit_x |
this |
last_yr |
all
|
X-position before calibrations |
| 1 |
o | QC1DB |
none |
|
PIXEL |
none | |
16 |
qc_slit_x |
this |
last_yr |
all
|
X-position after calibrations |
| 2 |
• | QC1DB |
MEDIAN |
532.5 |
PIXEL |
VAL | 525,540 |
15 |
qc_slit_y |
this |
last_yr |
all
|
Y-position before calibrations |
| 2 |
o | QC1DB |
none |
|
PIXEL |
none | |
16 |
qc_slit_y |
this |
last_yr |
all
|
Y-position after calibrations |
| 3 |
• | QC1DB |
MEDIAN |
270.0 |
YES |
none | |
15 |
qc_slit_a |
this |
last_yr |
all
|
Tilt angle before calibrations |
| 3 |
o | QC1DB |
none |
|
DEGREE |
none | |
16 |
qc_slit_a |
this |
last_yr |
all
|
Tilt angle after calibrations |
| 4 |
• | QC1DB |
MEDIAN |
2445093.0 |
ADU |
none | |
15 |
qc_slit_f |
this |
last_yr |
all
|
Arc line flux before calibrations |
| 4 |
o | QC1DB |
none |
|
ADU |
none | |
16 |
qc_slit_f |
this |
last_yr |
all
|
Arc line flux after calibrations |
| |
|
*Data sources: QC1DB: QC1 database; LOCAL: local text file
|
| Plot 1 | | data source: | isaac_slit
(QC1 database) |
dataset:
(numbers below apply to this dataset) | qc_slit_x | • |
| median: | 510.00003 | PIXEL |
| fixed thresholds: | 505.0...513.0 | PIXEL |
| N_data plotted: | 15 |
| [click on plot for closeup] |
| Plot 2 | | data source: | isaac_slit
(QC1 database) |
dataset:
(numbers below apply to this dataset) | qc_slit_y | • |
| median: | 532.5 | PIXEL |
| fixed thresholds: | 525.0...540.0 | PIXEL |
| N_data plotted: | 15 |
| [click on plot for closeup] |
| Plot 3 | | data source: | isaac_slit
(QC1 database) |
dataset:
(numbers below apply to this dataset) | qc_slit_a | • |
| median: | 270.0 | YES |
| thresholds: | none | |
| N_data plotted: | 15 |
| [click on plot for closeup] |
| Plot 4 | | data source: | isaac_slit
(QC1 database) |
dataset:
(numbers below apply to this dataset) | qc_slit_f | • |
| median: | 2445093.0 | ADU |
| thresholds: | none | |
| N_data plotted: | 15 |
| [click on plot for closeup] |
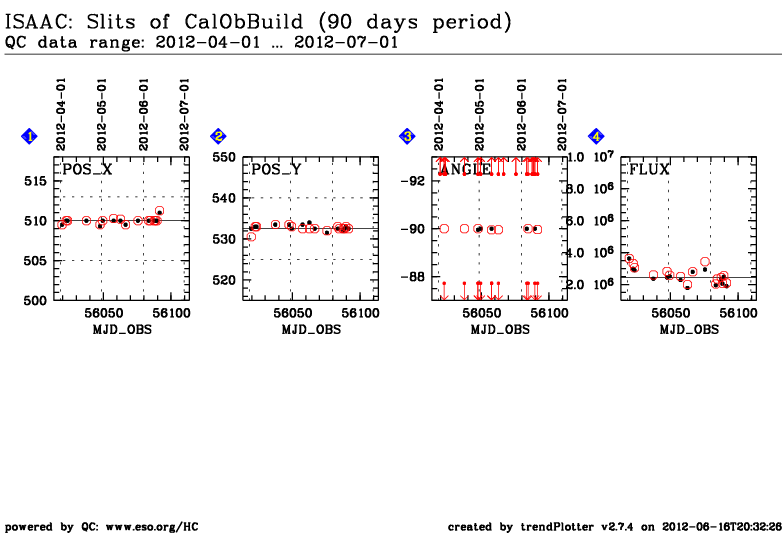
This is the trending plot of the through slit images taken as part of the
day time calibration sequence for spectroscopy.
This plot describes:
1. The x-position of the first slit image taken before the
spectroscopic arc and flat frames (black) and the second slit image taken
after the spectroscopic arc and flat frames (red).
2. The y-position of the slit images taken before (black) and after (red) the day time
calibrations.
3. The tilt angle of the slit images taken before (black) and after
(red) the day time
calibrations.
4. The flux of the slit images taken before (black) and after
(red) the day time
calibrations.
5. slit/camera movement during day-time calibrations: AFTER minus BEFORE measurement of Fig.1.
6. slit/camera movement during day-time calibrations: AFTER minus BEFORE measurement of Fig.2.
7. slit/camera movement during day-time calibrations: AFTER minus BEFORE measurement of Fig.3.
8. The time between both slit images in the calobuild batch in days.
Note 1 hour = 0.08 days.
The purpose of this trending is to check if the camera and grating have been
stable during the batch acquisition of day time calibrations.
Find more information about ISAAC slit frames
here.
General information
Click on any of the plots to see a close-up version.
The latest date is indicated on top of the plot, data points belonging to that date are specially marked.
If configured,
- statistical averages are indicated by a solid line, and thresholds by broken lines
- outliers are marked by a red asterisk. They are defined as data points outside the
threshold lines
- "aliens" (= data points outside the plot Y limits) are marked by a red arrow (↑ or ↓)
- you can download the data for each parameter set if the 'Data downloads' link shows up
|
