Plot
? |
Symb
? |
Source
* |
OPS?
** |
Average ? |
Thresholds ? |
N_
data |
QC1
parameter |
Data
downloads |
Remarks |
| method |
value |
unit |
method |
value |
| 1 |
□ | QC1DB |
yes (0) |
MEDIAN |
2.45 |
ADU |
none | |
7 |
qc_dispco2 |
this |
last_yr |
all
|
dispersion in Ang/pixel for SW, LR, SZ, argon lamp |
| 2 |
□ | QC1DB |
yes (0) |
MEDIAN |
|
ADU |
none | |
0 |
qc_dispco2 |
this |
last_yr |
all
|
dispersion in Ang/pixel for SW, LR, J, argon lamp |
| 2 |
x | QC1DB |
yes (0) |
MEDIAN |
3.52 |
ADU |
none | |
15 |
qc_dispco2 |
this |
last_yr |
all
|
dispersion in Ang/pixel for SW, LR, J, xenon lamp |
| 3 |
□ | QC1DB |
yes (0) |
MEDIAN |
|
ADU |
none | |
0 |
qc_dispco2 |
this |
last_yr |
all
|
dispersion in Ang/pixel for SW, LR, SH, argon lamp |
| 3 |
x | QC1DB |
yes (0) |
MEDIAN |
|
ADU |
none | |
0 |
qc_dispco2 |
this |
last_yr |
all
|
dispersion in Ang/pixel for SW, LR, SH, xenon lamp |
| 4 |
□ | QC1DB |
yes (0) |
MEDIAN |
|
ADU |
none | |
0 |
qc_dispco2 |
this |
last_yr |
all
|
dispersion in Ang/pixel for SW, LR, SK, argon lamp |
| 4 |
x | QC1DB |
yes (0) |
MEDIAN |
|
ADU |
none | |
0 |
qc_dispco2 |
this |
last_yr |
all
|
dispersion in Ang/pixel for SW, LR, SK, xenon lamp |
| 5 |
• | QC1DB |
yes (0) |
MEDIAN |
0.594 |
ADU |
none | |
12 |
qc_dispco2 |
this |
last_yr |
all
|
dispersion in Ang/pixel for SW, MR, SH, argon and xenon lamp |
| 6 |
• | QC1DB |
yes (0) |
MEDIAN |
0.584 |
ADU |
none | |
11 |
qc_dispco2 |
this |
last_yr |
all
|
dispersion in Ang/pixel for SW, MR, J, argon and xenon lamp |
| 7 |
• | QC1DB |
yes (0) |
MEDIAN |
0.753 |
ADU |
none | |
9 |
qc_dispco2 |
this |
last_yr |
all
|
dispersion in Ang/pixel for SW, MR, SH, argon and xenon lamp |
| 8 |
• | QC1DB |
yes (0) |
MEDIAN |
1.22 |
ADU |
none | |
20 |
qc_dispco2 |
this |
last_yr |
all
|
dispersion in Ang/pixel for SW, MR, SK, argon and xenon lamp |
| |
|
*Data sources: QC1DB: QC1 database; LOCAL: local text file | **OPS: OPSLOG data are included
|
Plot 1
scores: no current data
| | data source: | isaac_arc
(QC1 database) |
| dataset: | qc_dispco2 | □ |
| median: | 2.45 | ADU |
| thresholds: | none | |
| N_data plotted: | 7 |
| [click on plot for closeup] |
Plot 2
scores: not implemented
| | data source: | isaac_arc
(QC1 database) |
dataset:
(numbers below apply to this dataset) | qc_dispco2 | □ |
| median: | no data | ADU |
| thresholds: | none | |
| N_data plotted: | 0 |
| [click on plot for closeup] |
Plot 3
scores: not implemented
| | data source: | isaac_arc
(QC1 database) |
dataset:
(numbers below apply to this dataset) | qc_dispco2 | □ |
| median: | no data | ADU |
| thresholds: | none | |
| N_data plotted: | 0 |
| [click on plot for closeup] |
Plot 4
scores: not implemented
| | data source: | isaac_arc
(QC1 database) |
dataset:
(numbers below apply to this dataset) | qc_dispco2 | □ |
| median: | no data | ADU |
| thresholds: | none | |
| N_data plotted: | 0 |
| [click on plot for closeup] |
Plot 5
scores: no current data
| | data source: | isaac_arc
(QC1 database) |
| dataset: | qc_dispco2 | • |
| median: | 0.594 | ADU |
| thresholds: | none | |
| N_data plotted: | 12 |
| [click on plot for closeup] |
Plot 6
scores: no current data
| | data source: | isaac_arc
(QC1 database) |
| dataset: | qc_dispco2 | • |
| median: | 0.584 | ADU |
| thresholds: | none | |
| N_data plotted: | 11 |
| [click on plot for closeup] |
Plot 7
scores: no current data
| | data source: | isaac_arc
(QC1 database) |
| dataset: | qc_dispco2 | • |
| median: | 0.753 | ADU |
| thresholds: | none | |
| N_data plotted: | 9 |
| [click on plot for closeup] |
Plot 8
scores: no current data
| | data source: | isaac_arc
(QC1 database) |
| dataset: | qc_dispco2 | • |
| median: | 1.22 | ADU |
| thresholds: | none | |
| N_data plotted: | 20 |
| [click on plot for closeup] |
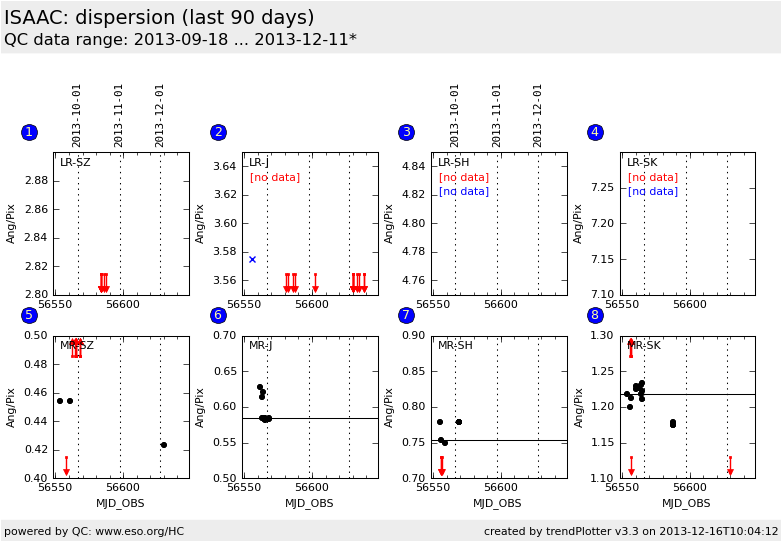
This is the trending plot for the ISAAC arc lamp calibrations of the SW-arm
The QC parameter is the dispersion as
derived
from the wavelength solution of the pipeline recipe (HIERARCH ESO QC DISPC02) . The parameter is given in
ang/pixel units.
These plots describe:
1. Dispersion for SW-arm, LR-grating, SZ-filter. Only Argon lamp used.Bb>
2. Dispersion for SW-arm, LR-grating, J-filter. Argon (red diamont) and Xenon (blue cross).
3. Dispersion for SW-arm, LR-grating, SH-filter. Argon (red diamont) and Xenon (blue cross).
4. Dispersion for SW-arm, LR-grating, SK-filter. Argon (red diamont) and Xenon (blue cross).
5. Dispersion for SW-arm, MR-grating, SZ-filter. Both Argon and Xenon lamps are on.
6. Dispersion for SW-arm, MR-grating, J-filter. Both Argon and Xenon lamps are on.
7. Dispersion for SW-arm, MR-grating, SH-filter. Both Argon and Xenon lamps are on.
8. Dispersion for SW-arm, MR-grating, SK-filter. Both Argon and Xenon lamps are on.
The color coding is: red for Argon alone lamp exposure, blue for Xenon alone
lamp exposure and black for
Argon+Xenon lamp exposure. For the LR grating there is for each lamp
one
dedicated exposure. For the MR grating there is one exposure showing
the mixed spectrum of both lamps.
Find more information about ISAAC QC parameters derived from twilight flats
here.
General information
Click on any of the plots to see a close-up version.
If applicable, the latest values from Paranal ops logs are plotted as blue dots. More information about those values, including a download option, is available in the OPS column.
The latest date is indicated on top of the plot, data points belonging to that date are specially marked.
If configured,
- statistical averages are indicated by a solid line, and thresholds by broken lines
- outliers are marked by a red asterisk. They are defined as data points outside the
threshold lines
- "aliens" (= data points outside the plot Y limits) are marked by a red arrow (↑ or ↓)
- you can download the data for each parameter set if the 'Data downloads' link shows up
|
