Plot
? |
Symb
? |
Source
* |
OPS?
** |
Average ? |
Thresholds ? |
N_
data |
QC1
parameter |
Data
downloads |
Remarks |
| method |
value |
unit |
method |
value |
| 1 |
∗ | QC1DB |
no |
none |
|
ADU |
none | |
36 |
flux_off |
this |
last_yr |
all
|
off-lamp flux for LW, LR, SL, all slits |
| 2 |
∗ | QC1DB |
no |
none |
|
ADU |
none | |
2 |
flux_off |
this |
last_yr |
all
|
off-lamp flux for LW, LR, M, all slits |
| 3 |
∗ | QC1DB |
no |
none |
|
ADU |
none | |
106 |
flux_off |
this |
last_yr |
all
|
off-lamp flux for LW, MR, SL, all slits |
| 4 |
∗ | QC1DB |
no |
none |
|
ADU |
none | |
13 |
flux_off |
this |
last_yr |
all
|
off-lamp flux for LW, MR, M, all slits |
| |
|
*Data sources: QC1DB: QC1 database; LOCAL: local text file | **OPS: OPSLOG data are included
|
Plot 2
scores: no current data
| | data source: | isaac_spflat
(QC1 database) |
| dataset: | flux_off | ∗ |
| average: | none |
| thresholds: | none |
| N_data plotted: | 2 |
| [click on plot for closeup] |
Plot 1
scores: no current data
| | data source: | isaac_spflat
(QC1 database) |
| dataset: | flux_off | ∗ |
| average: | none |
| thresholds: | none |
| N_data plotted: | 36 |
| [click on plot for closeup] |
Plot 4
scores: no current data
| | data source: | isaac_spflat
(QC1 database) |
| dataset: | flux_off | ∗ |
| average: | none |
| thresholds: | none |
| N_data plotted: | 13 |
| [click on plot for closeup] |
Plot 3
scores: no current data
| | data source: | isaac_spflat
(QC1 database) |
| dataset: | flux_off | ∗ |
| average: | none |
| thresholds: | none |
| N_data plotted: | 106 |
| [click on plot for closeup] |
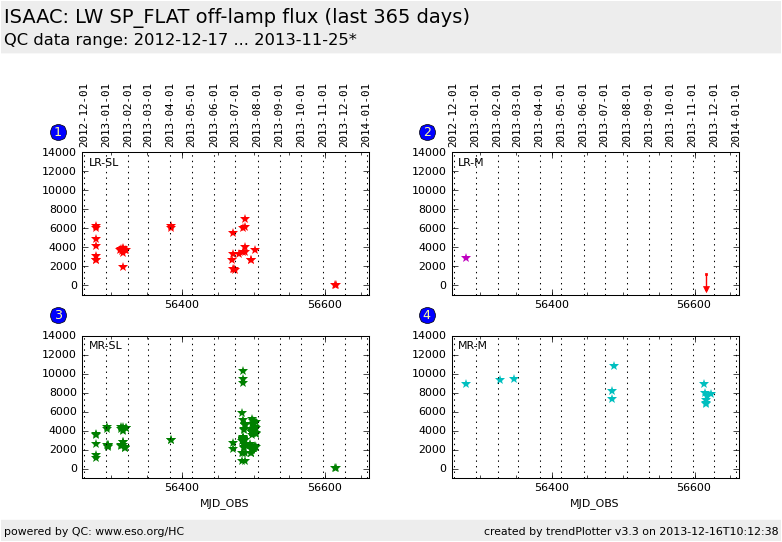
This is the trending plot for the ISAAC
QC parameters derived from long wavelength arm (LW) spectroscopic flat frames.
These plots describe:
1. median counts of the off-lamp raw flat frames LW-LR-SL (3.55 um), all slits.
2. median counts of the off-lamp raw flat frames LW-LR-M (4.75 um), all slits.
3. median counts of the off-lamp raw flat frames LW-MR-SL, all slits.
4. median counts of the off-lamp raw flat frames LW-MR-M, all slits.
General information
Click on any of the plots to see a close-up version.
The latest date is indicated on top of the plot, data points belonging to that date are specially marked.
If configured,
- statistical averages are indicated by a solid line, and thresholds by broken lines
- outliers are marked by a red asterisk. They are defined as data points outside the
threshold lines
- "aliens" (= data points outside the plot Y limits) are marked by a red arrow (↑ or ↓)
- you can download the data for each parameter set if the 'Data downloads' link shows up
|
