Plot
? |
Symb
? |
Source
* |
OPS?
** |
Average ? |
Thresholds ? |
N_
data |
QC1
parameter |
Data
downloads |
Remarks |
| method |
value |
unit |
method |
value |
| 1 |
• | QC1DB |
yes (0) |
MEDIAN |
34 |
MAG |
VAL | 24.1,24.8 |
49 |
zpoint |
this |
last_yr |
all
|
median of 5 measurements, flatfielded, no linearity correction, corrected for extinction |
| 2 |
• | QC1DB |
yes (0) |
MEDIAN |
33.2 |
MAG |
VAL | 23.6,24.3 |
46 |
zpoint |
this |
last_yr |
all
|
median of 5 measurements, flatfielded, no linearity correction, corrected for extinction |
| 4 |
• | QC1DB |
yes (0) |
MEDIAN |
34.1 |
MAG |
VAL | 23.6,24.3 |
46 |
zpoint |
this |
last_yr |
all
|
median of 5 measurements, flatfielded, no linearity correction, corrected for extinction |
| |
|
*Data sources: QC1DB: QC1 database; LOCAL: local text file | **OPS: OPSLOG data are included
|
Plot 1
scores: not implemented
| | data source: | isaac_zp
(QC1 database) |
| dataset: | zpoint | • |
| median: | 34 | MAG |
| fixed thresholds: | 24.1...24.8 | MAG |
| N_data plotted: | 49 |
| [click on plot for closeup] |
Plot 2
scores: not implemented
| | data source: | isaac_zp
(QC1 database) |
| dataset: | zpoint | • |
| median: | 33.2 | MAG |
| fixed thresholds: | 23.6...24.3 | MAG |
| N_data plotted: | 46 |
| [click on plot for closeup] |
Plot 4
scores: not implemented
| | data source: | isaac_zp
(QC1 database) |
| dataset: | zpoint | • |
| median: | 34.1 | MAG |
| fixed thresholds: | 23.6...24.3 | MAG |
| N_data plotted: | 46 |
| [click on plot for closeup] |
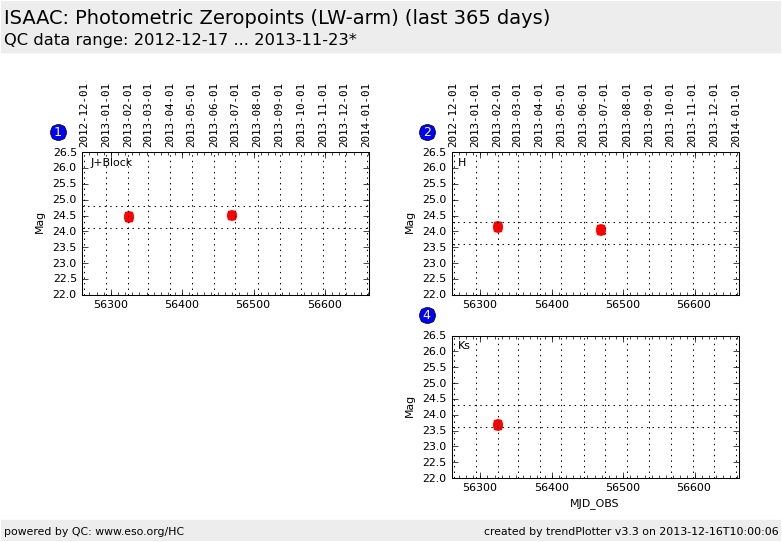
This is the trending plot for the ISAAC photometric zeropoints for the LW-arm
These plots describe:
1. Photometric Zeropoint LW arm, J+Block filter, not corrected for atmospheric extinction
2. Photometric Zeropoint LW arm, H filter, not corrected for atmospheric extinction
4. Photometric Zeropoint LW arm, Ks filter, not corrected for atmospheric extinction
Find more information about ISAAC photometric zeropoint frames
here.
General information
Click on any of the plots to see a close-up version.
If applicable, the latest values from Paranal ops logs are plotted as blue dots. More information about those values, including a download option, is available in the OPS column.
The latest date is indicated on top of the plot, data points belonging to that date are specially marked.
If configured,
- statistical averages are indicated by a solid line, and thresholds by broken lines
- outliers are marked by a red asterisk. They are defined as data points outside the
threshold lines
- "aliens" (= data points outside the plot Y limits) are marked by a red arrow (↑ or ↓)
- you can download the data for each parameter set if the 'Data downloads' link shows up
|
