Plot
? |
Symb
? |
Source
* |
Average ? |
Thresholds ? |
N_
data |
QC1
parameter |
Data
downloads |
Remarks |
| method |
value |
unit |
method |
value |
| 1 |
• | QC1DB |
none |
|
NONE |
VAL | 17,19 |
0 |
averaged_err_photA |
this |
last_yr |
all
|
alfhya |
| 1 |
• | QC1DB |
none |
|
NONE |
VAL | 17,19 |
0 |
averaged_err_photA |
this |
last_yr |
all
|
alftau |
| 1 |
• | QC1DB |
none |
|
NONE |
VAL | 17,19 |
2 |
averaged_err_photA |
this |
last_yr |
all
|
etasgr |
| 1 |
• | QC1DB |
none |
|
NONE |
VAL | 17,19 |
0 |
averaged_err_photA |
this |
last_yr |
all
|
alfboo |
| 1 |
• | QC1DB |
none |
|
NONE |
VAL | 17,19 |
0 |
averaged_err_photA |
this |
last_yr |
all
|
siglib |
| 1 |
• | QC1DB |
none |
|
NONE |
VAL | 17,19 |
0 |
averaged_err_photA |
this |
last_yr |
all
|
alfcma |
| 2 |
• | QC1DB |
none |
|
NONE |
VAL | 17,19 |
0 |
averaged_err_photB |
this |
last_yr |
all
|
alfhya |
| 2 |
• | QC1DB |
none |
|
NONE |
VAL | 17,19 |
0 |
averaged_err_photB |
this |
last_yr |
all
|
alftau |
| 2 |
• | QC1DB |
none |
|
NONE |
VAL | 17,19 |
2 |
averaged_err_photB |
this |
last_yr |
all
|
etasgr |
| 2 |
• | QC1DB |
none |
|
NONE |
VAL | 17,19 |
0 |
averaged_err_photB |
this |
last_yr |
all
|
alfboo |
| 2 |
• | QC1DB |
none |
|
NONE |
VAL | 17,19 |
0 |
averaged_err_photB |
this |
last_yr |
all
|
siglib |
| 2 |
• | QC1DB |
none |
|
NONE |
VAL | 17,19 |
0 |
averaged_err_photB |
this |
last_yr |
all
|
alfcma |
| |
|
*Data sources: QC1DB: QC1 database; LOCAL: local text file
|
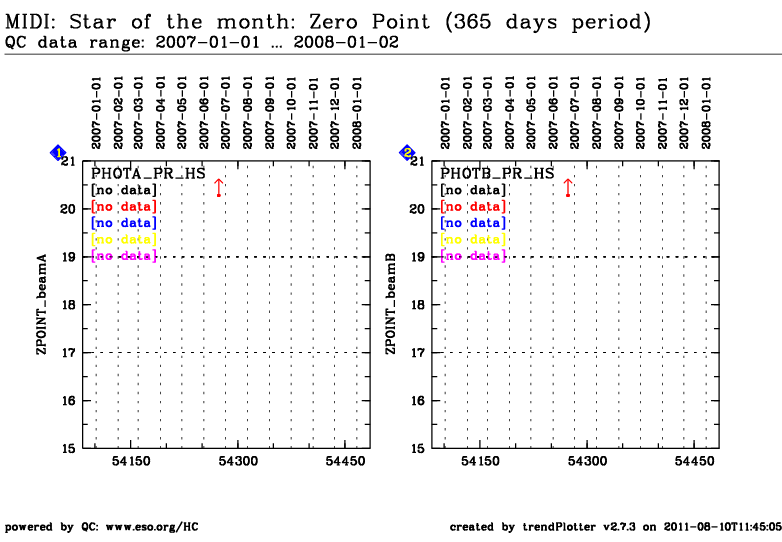
| Plot 1 | | data source: | midi_TransferFunction
(QC1 database) |
dataset:
(numbers below apply to this dataset) | averaged_err_photA | • |
| average: | none |
| fixed thresholds: | 17.0...19.0 | NONE |
| N_data plotted: | 0 |
| [click on plot for closeup] |
| Plot 2 | | data source: | midi_TransferFunction
(QC1 database) |
dataset:
(numbers below apply to this dataset) | averaged_err_photB | • |
| average: | none |
| fixed thresholds: | 17.0...19.0 | NONE |
| N_data plotted: | 0 |
| [click on plot for closeup] |
The zeropoint is calculated on the star of the month. It is calculated using
zpoint=mag + 2.5*log10(flux/DIT)
where mag is the magnitude of the object in N band, flux is the Target Photometry of beam A or B (measured in bin2),
and DIT is the detector DIT. There are no corrections applied.
Please note that the zeropoint parameters in the QC1 database are misleadingly called
averaged_err_photA and averaged_err_photB.
General information
Click on any of the plots to see a close-up version.
The latest date is indicated on top of the plot, data points belonging to that date are specially marked.
If configured,
- statistical averages are indicated by a solid line, and thresholds by broken lines
- outliers are marked by a red asterisk. They are defined as data points outside the
threshold lines
- "aliens" (= data points outside the plot Y limits) are marked by a red arrow (↑ or ↓)
- you can download the data for each parameter set if the 'Data downloads' link shows up
|
