|
|
| MIDI trending system: HISTORY report |
|
|
|
Last update: 2014-01-12T00:20:44 (UT)
|
|
|
|
|
*Date on this monitor changes at 21:00 UT |
|

|
|
|
Plot
? |
Symb
? |
Source
* |
Average ? |
Thresholds ? |
N_
data |
QC1
parameter |
Data
downloads |
Remarks |
| method |
value |
unit |
method |
value |
| 1 |
• | QC1DB |
none |
|
NONE |
VAL | 0.0,1.1 |
11 |
TF_bin2 |
this |
last_yr |
all
|
alfhya |
| 1 |
• | QC1DB |
none |
|
NONE |
VAL | 0.0,1.1 |
5 |
TF_bin2 |
this |
last_yr |
all
|
alftau |
| 1 |
• | QC1DB |
none |
|
NONE |
VAL | 0.0,1.1 |
24 |
TF_bin2 |
this |
last_yr |
all
|
etasgr |
| 1 |
• | QC1DB |
none |
|
NONE |
VAL | 0.0,1.1 |
5 |
TF_bin2 |
this |
last_yr |
all
|
alfboo |
| 1 |
• | QC1DB |
none |
|
NONE |
VAL | 0.0,1.1 |
3 |
TF_bin2 |
this |
last_yr |
all
|
siglib |
| 1 |
• | QC1DB |
none |
|
NONE |
VAL | 0.0,1.1 |
7 |
TF_bin2 |
this |
last_yr |
all
|
alfcma |
| 2 |
• | QC1DB |
none |
|
NONE |
VAL | 0.0,1.1 |
11 |
TF_bin3 |
this |
last_yr |
all
|
alfhya |
| 2 |
• | QC1DB |
none |
|
NONE |
VAL | 0.0,1.1 |
5 |
TF_bin3 |
this |
last_yr |
all
|
alftau |
| 2 |
• | QC1DB |
none |
|
NONE |
VAL | 0.0,1.1 |
24 |
TF_bin3 |
this |
last_yr |
all
|
etasgr |
| 2 |
• | QC1DB |
none |
|
NONE |
VAL | 0.0,1.1 |
5 |
TF_bin3 |
this |
last_yr |
all
|
alfboo |
| 2 |
• | QC1DB |
none |
|
NONE |
VAL | 0.0,1.1 |
3 |
TF_bin3 |
this |
last_yr |
all
|
siglib |
| 2 |
• | QC1DB |
none |
|
NONE |
VAL | 0.0,1.1 |
7 |
TF_bin3 |
this |
last_yr |
all
|
alfcma |
| 3 |
• | QC1DB |
none |
|
NONE |
VAL | 0.0,1.1 |
11 |
TF_bin4 |
this |
last_yr |
all
|
alfhya |
| 3 |
• | QC1DB |
none |
|
NONE |
VAL | 0.0,1.1 |
5 |
TF_bin4 |
this |
last_yr |
all
|
alftau |
| 3 |
• | QC1DB |
none |
|
NONE |
VAL | 0.0,1.1 |
24 |
TF_bin4 |
this |
last_yr |
all
|
etasgr |
| 3 |
• | QC1DB |
none |
|
NONE |
VAL | 0.0,1.1 |
5 |
TF_bin4 |
this |
last_yr |
all
|
alfboo |
| 3 |
• | QC1DB |
none |
|
NONE |
VAL | 0.0,1.1 |
3 |
TF_bin4 |
this |
last_yr |
all
|
siglib |
| 3 |
• | QC1DB |
none |
|
NONE |
VAL | 0.0,1.1 |
7 |
TF_bin4 |
this |
last_yr |
all
|
alfcma |
| 4 |
• | QC1DB |
none |
|
NONE |
VAL | 0.0,1.1 |
11 |
TF_bin5 |
this |
last_yr |
all
|
alfhya |
| 4 |
• | QC1DB |
none |
|
NONE |
VAL | 0.0,1.1 |
5 |
TF_bin5 |
this |
last_yr |
all
|
alftau |
| 4 |
• | QC1DB |
none |
|
NONE |
VAL | 0.0,1.1 |
24 |
TF_bin5 |
this |
last_yr |
all
|
etasgr |
| 4 |
• | QC1DB |
none |
|
NONE |
VAL | 0.0,1.1 |
5 |
TF_bin5 |
this |
last_yr |
all
|
alfboo |
| 4 |
• | QC1DB |
none |
|
NONE |
VAL | 0.0,1.1 |
3 |
TF_bin5 |
this |
last_yr |
all
|
siglib |
| 4 |
• | QC1DB |
none |
|
NONE |
VAL | 0.0,1.1 |
7 |
TF_bin5 |
this |
last_yr |
all
|
alfcma |
| |
|
*Data sources: QC1DB: QC1 database; LOCAL: local text file
|
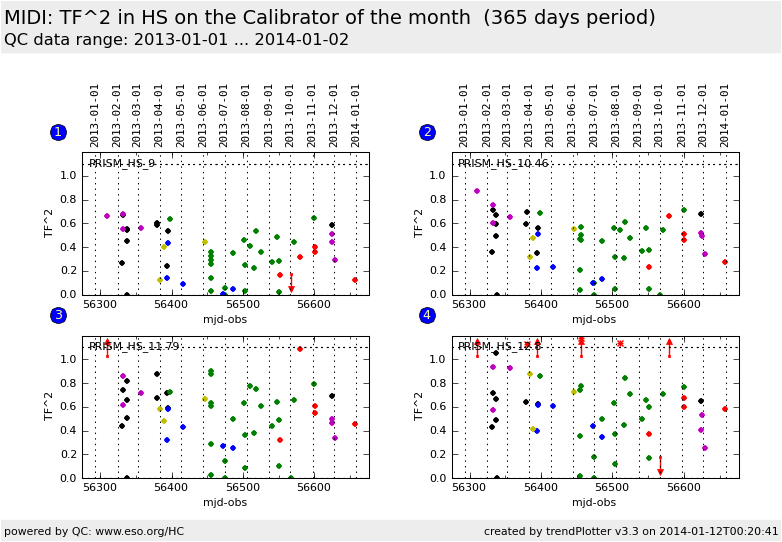
| Plot 1 | | data source: | midi_TransferFunction
(QC1 database) |
dataset:
(numbers below apply to this dataset) | TF_bin2 | • |
| average: | none |
| fixed thresholds: | 0.0...1.1 | NONE |
| N_data plotted: | 11 |
| [click on plot for closeup] |
| Plot 2 | | data source: | midi_TransferFunction
(QC1 database) |
dataset:
(numbers below apply to this dataset) | TF_bin3 | • |
| average: | none |
| fixed thresholds: | 0.0...1.1 | NONE |
| N_data plotted: | 11 |
| [click on plot for closeup] |
| Plot 3 | | data source: | midi_TransferFunction
(QC1 database) |
dataset:
(numbers below apply to this dataset) | TF_bin4 | • |
| average: | none |
| fixed thresholds: | 0.0...1.1 | NONE |
| N_data plotted: | 11 |
| [click on plot for closeup] |
| Plot 4 | | data source: | midi_TransferFunction
(QC1 database) |
dataset:
(numbers below apply to this dataset) | TF_bin5 | • |
| average: | none |
| fixed thresholds: | 0.0...1.1 | NONE |
| N_data plotted: | 11 |
| [click on plot for closeup] |
The Transfer Function is measured on the Star of the month.
It should be measured each VLTI SM night at the beginning of the night.
The TF is measured in 5 bins. Each bin is averaged over 5 channels.
bin1: 8.64 microns.
bin2: 9 microns.
bin3: 10.46 microns.
bin4: 11.79 microns.
bin5: 12.8 microns.
The TF is displayed here for bins 2 to 5.
General information
Click on any of the plots to see a close-up version.
The latest date is indicated on top of the plot, data points belonging to that date are specially marked.
If configured,
- statistical averages are indicated by a solid line, and thresholds by broken lines
- outliers are marked by a red asterisk. They are defined as data points outside the
threshold lines
- "aliens" (= data points outside the plot Y limits) are marked by a red arrow (↑ or ↓)
- you can download the data for each parameter set if the 'Data downloads' link shows up
|
|