The recipe midi_profile is applied to chopped PHOTOMETRY frames. For
each window on the detector (Data1, Data2 for HIGH_SENS) and Data1 to
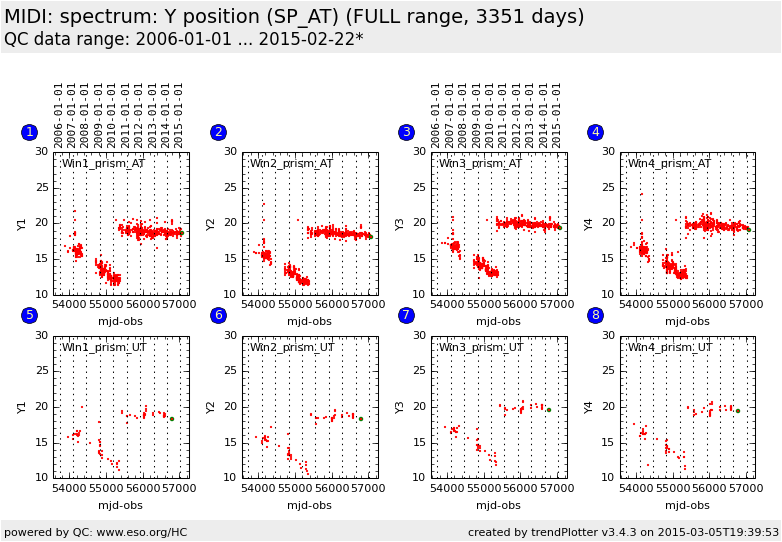
Data4 for SCI_PHOT, a profile is identified and a mask is created. The
recipe also calculates the y position of the mask in 5 different bins
These results are used to monitor the vertical position of the
spectrum (using the bin 3: HIERARCH ESO QC Y1 CENT BINNED3). A
problem has been detected with the PRISM (the y position is moving 1
pixel per year).
General information
Click on any of the plots to see a close-up version.
The latest date is indicated on top of the plot.
If configured,
data points belonging to the latest date are specially marked
statistical averages are indicated by a solid line, and thresholds by broken lines
outliers are marked by a red asterisk. They are defined as data points outside the
threshold lines
"aliens" (= data points outside the plot Y limits) are marked by a red arrow (↑ or ↓)
you can download the data for each parameter set if the 'Data downloads' link shows up
