Plot
? |
Symb
? |
Source
* |
Average ? |
Thresholds ? |
N_
data |
QC1
parameter |
Data
downloads |
Remarks |
| method |
value |
unit |
method |
value |
| 1 |
• | QC1DB |
MEDIAN |
0.0381 |
none |
none | |
7666 |
qc_std_ellipticity |
all (full time range)
| g_SDSS stellar ellipticity (1 - b/a) averaged over all 32 detectors |
| 2 |
• | QC1DB |
MEDIAN |
0.0114 |
none |
none | |
7666 |
qc_std_ellipticity |
all (full time range)
| g_SDSS standard deviation of the stellar ellipticity |
| 3 |
• | QC1DB |
MEDIAN |
0.0451 |
none |
none | |
196892 |
qc_std_ellipticity |
all (full time range)
| g_SDSS stellar ellipticity (1 - b/a) for each individual detector |
| 4 |
■ | LOCAL |
none |
|
none |
none | |
5728 |
det_id |
n/a |
score per detector:
GREEN = within the thresholds |
| 4 |
■ | LOCAL |
none |
|
none |
none | |
0 |
det_id |
n/a |
score per detector:
RED = beyond the thresholds |
| |
|
*Data sources: QC1DB: QC1 database; LOCAL: local data source
|
Plot 1
scores: not implemented
| | data source: | omegacam_std
(QC1 database) |
| dataset: | qc_std_ellipticity | • |
| median: | 0.0381 | none |
| thresholds: | none | |
| N_data plotted: | 7666 |
| [click plot for closeup] |
Plot 2
scores: not implemented
| | data source: | omegacam_std
(QC1 database) |
| dataset: | qc_std_ellipticity | • |
| median: | 0.0114 | none |
| thresholds: | none | |
| N_data plotted: | 7666 |
| [click plot for closeup] |
Plot 3
scores: not implemented
| | data source: | omegacam_std
(QC1 database) |
| dataset: | qc_std_ellipticity | • |
| median: | 0.0451 | none |
| thresholds: | none | |
| N_data plotted: | 196892 |
| [click plot for closeup] |
Plot 4
scores: not implemented
| | data source: | local data source
|
dataset:
(numbers below apply to this dataset) | det_id | ■ |
| average: | none |
| thresholds: | none |
| N_data plotted: | 5728 |
| [click plot for closeup] |
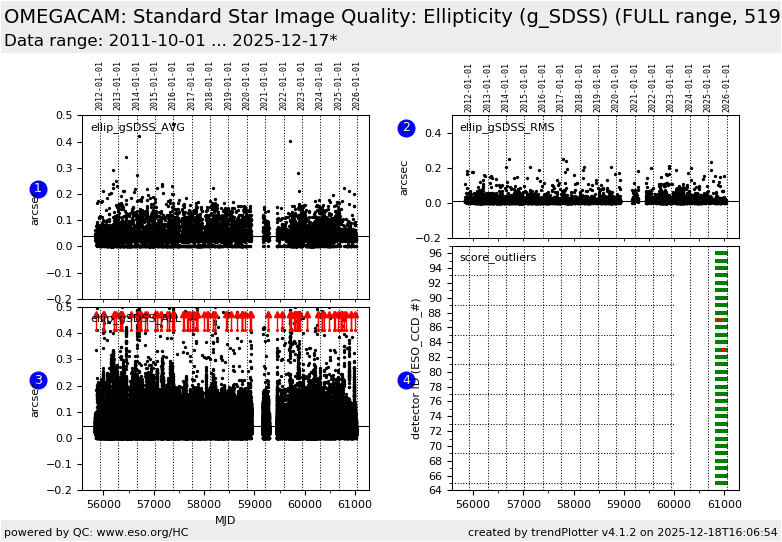
Trending plots for standard star image quality (Ellipticity): g_SDSS .
QC parameters are derived from each of 32 detectors of OmegaCAM STD,ZEROPOINT frames.
DB Name: omegacam_std
Fits header: QC.STD.ELLIPTICITY
QC1 DB: qc_std_ellipticity
Description:
The ellipticity (1 - b/a) is measured only for source identified as
stellar (CLASS_STAR >= 0.90 from the SExtractor detection) and is contained in the pipeline product frame ZEROPOINTS
Setup:
BIN.X / BIN.Y / READ.MODE / READ.SPEED = 1/1/normal/normal
These Health Check plots describe:
Fig. 1 ellip_rSDSS_AVG: The g_SDSS stellar ellipticities (1-b/a) averaged over all 32 detectors.
This plot is sensitive to any changes common to all detectors.
Fig. 2 ellip_rSDSS_ALL: The g_SDSS stellar ellipticities
(1-b/a) for each
individual detector. This plot is sensitive changes in individual detectors.
Fig. 3 ellip_rSDSS_RMS: The rms of the g_SDSS stellar ellipticities
averaged over all 32 detectors.
OmegaCAM detector plane layout (detector_ID locations):

General information
Click on any of the plots to see a close-up version.
The latest date is indicated on top of the plot.
If configured,
- data points belonging to the latest date are specially marked
- statistical averages are indicated by a solid line, and thresholds by broken lines
- outliers are marked by a red asterisk. They are defined as data points outside the
threshold lines
- "aliens" (= data points outside the plot Y limits) are marked by a red arrow (↑ or ↓)
- you can download the data for each parameter set if the 'Data downloads' link shows up
|
