Plot
? |
Symb
? |
Source
* |
Average ? |
Thresholds ? |
N_
data |
QC1
parameter |
Data
downloads |
Remarks |
| method |
value |
unit |
method |
value |
| 1 |
• | QC1DB |
MEDIAN |
259 |
ADU |
VAL | 0.,550. |
108 |
qc_bias_hotpixels |
this |
last_yr |
all
|
number of hot pixels detected in the BIAS averaged over all 32 detectors |
| 2 |
• | QC1DB |
MEDIAN |
16 |
ADU |
none | |
2216 |
qc_bias_hotpixels |
this |
last_yr |
all
|
number of hot pixels detected in the BIAS for all the detectors |
| 3 |
■ | LOCAL |
none |
|
none |
none | |
3456 |
det_id |
n/a |
score per detector:
GREEN = within the thresholds |
| 3 |
■ | LOCAL |
none |
|
none |
none | |
0 |
det_id |
n/a |
score per detector:
RED = beyond the thresholds |
| |
|
*Data sources: QC1DB: QC1 database; LOCAL: local data source
|
Plot 1
scores:  12| 12|
| | data source: | omegacam_bias
(QC1 database) |
| dataset: | qc_bias_hotpixels | • |
| median: | 259 | ADU |
| fixed thresholds: | 0.0...550.0 | ADU |
| N_data plotted: | 108 |
| [click plot for closeup] |
Plot 2
scores: not implemented
| | data source: | omegacam_bias
(QC1 database) |
| dataset: | qc_bias_hotpixels | • |
| median: | 16 | ADU |
| thresholds: | none | |
| N_data plotted: | 2216 |
| [click plot for closeup] |
Plot 3
scores: not implemented
| | data source: | local data source
|
dataset:
(numbers below apply to this dataset) | det_id | ■ |
| average: | none |
| thresholds: | none |
| N_data plotted: | 3456 |
| [click plot for closeup] |
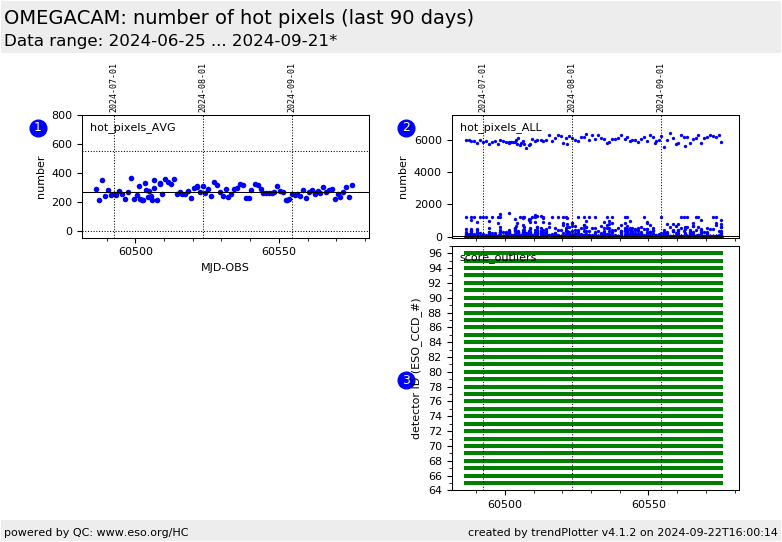
Trending plots for the number of hot pixels in the bias frames.
QC parameters are derived from each of 32 detectors of OmegaCAM BIAS frames.
DB Name: omegacam_bias
Fits header: QC.NUMBER.HOT.PIXELS
QC1 DB: qc_bias_hotpixels / qc_temp_mosaic_plate
Description:
The number of hot pixels detected in the bias pipeline product frame HOT_PIXELS_MAP
Setup:
BIN.X / BIN.Y / READ.MODE / READ.SPEED = 1/1/normal/normal
These Health Check plots describe:
Fig. 1 hot_pixels_AVG: The number of detected hot pixels averaged over
all 32 detectors.
This plot is sensitive to any changes common to all detectors.
Fig. 2 hot_pixels_ALL: The number of hot pixels found in
each individual detector (detectors: ESO_CCD_68, ESO_CCD_82,
ESO_CCD_84, and ESO_CCD_90 consistently show very high values). This plot is sensitive to changes in each
detector.
Fig. 3 score_outliers: Scores of the number of hot
pixels as measured for each of the 32 detectors.
Green = within the defined thresholds.
Red = beyond the defined thresholds.
OmegaCAM detector plane layout (detector_ID locations):

General information
Click on any of the plots to see a close-up version.
The latest date is indicated on top of the plot.
If configured,
- data points belonging to the latest date are specially marked
- statistical averages are indicated by a solid line, and thresholds by broken lines
- outliers are marked by a red asterisk. They are defined as data points outside the
threshold lines
- "aliens" (= data points outside the plot Y limits) are marked by a red arrow (↑ or ↓)
- you can download the data for each parameter set if the 'Data downloads' link shows up
|