Plot 7 scores: [an error occurred while processing this directive]
data source:
pionier_spectral_calib (QC1 database)
dataset: (numbers below apply to this dataset)
spec_cal_effwave
•
average:
none
thresholds:
none
N_data plotted:
0
[click plot for closeup]
Plot 8 scores: [an error occurred while processing this directive]
data source:
pionier_spectral_calib (QC1 database)
dataset: (numbers below apply to this dataset)
spec_cal_effband
•
average:
none
thresholds:
none
N_data plotted:
0
[click plot for closeup]
Plot 9 scores: [an error occurred while processing this directive]
data source:
pionier_spectral_calib (QC1 database)
dataset: (numbers below apply to this dataset)
spec_cal_effwave_ptp
•
average:
none
thresholds:
none
N_data plotted:
0
[click plot for closeup]
This plot
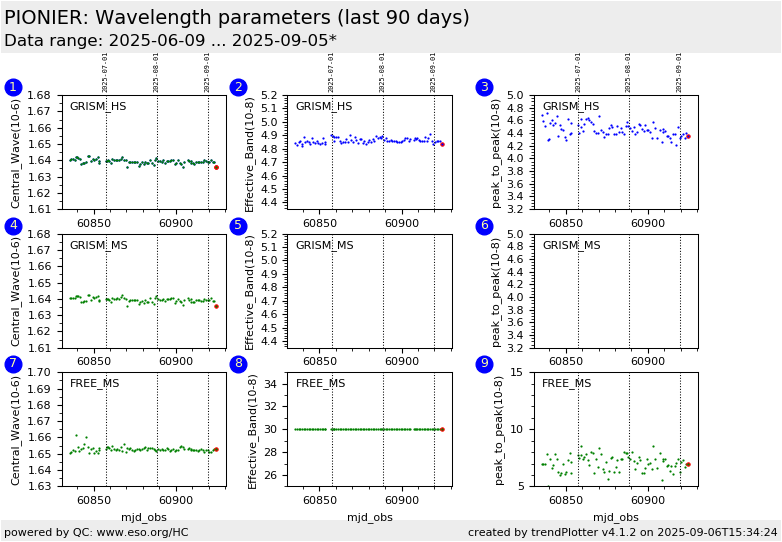
The pipeline calculates the central wavelength as well as the average value of the effective bandwidth for the 2 dispersive modes : GRISM and FREE.
Plots 3 and 6 (peak_to_peak) monitor the maximum variation of the effective band between the different baselines
The detector polarization voltages (DET.POLAR) are :
High Sensitivity : 7100 mV
Medium_ Sensitivity: 5000 mV
Low_Sensitivity : 1000 mV
General information
Click on any of the plots to see a close-up version.
The latest date is indicated on top of the plot.
If configured,
data points belonging to the latest date are specially marked
statistical averages are indicated by a solid line, and thresholds by broken lines
outliers are marked by a red asterisk. They are defined as data points outside the
threshold lines
"aliens" (= data points outside the plot Y limits) are marked by a red arrow (↑ or ↓)
you can download the data for each parameter set if the 'Data downloads' link shows up
