|
C
[page auto-refreshes after 300 sec]
[press Ctrl+R to enforce refresh of scores and dates]
|
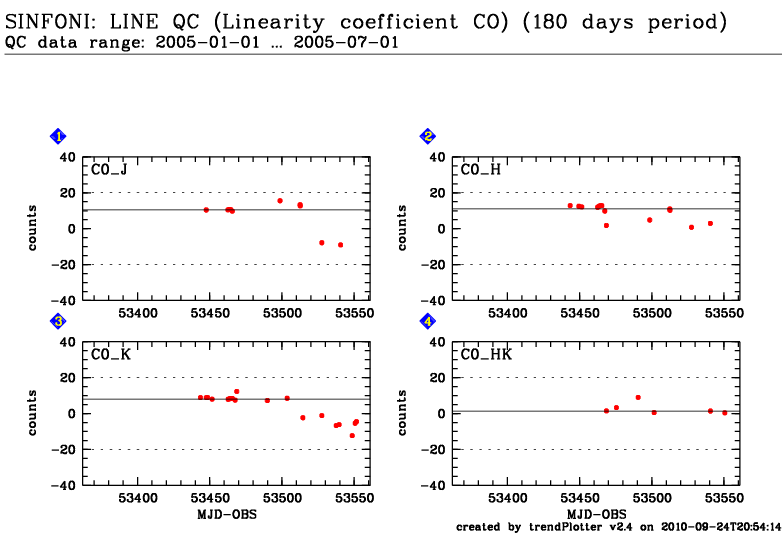
| SINFONI trending system: HISTORY plot |
|
Last update: 2010-09-24T20:54:38 (UT)
|
|
|
|
|
*Date on this monitor changes at 21:00 UT |
|

|
|
|
Plot
? |
Symb
? |
Source
* |
Average ? |
Thresholds ? |
N_
data |
QC1
parameter |
Data
downloads |
Remarks |
| method |
value |
unit |
method |
value |
| 1 |
• | QC1DB |
MEDIAN |
10.482 |
counts |
VAL | -20.0,20.0 |
10 |
qc_bpm_lin0_mean |
this |
last_yr |
all
|
J-band linearity coefficient (mean) C0 (nlin(x) = C0 + C1x + C2x^2 + C3x^3) (only for the 25 mas camera scale) |
| 2 |
• | QC1DB |
MEDIAN |
10.9553 |
counts |
VAL | -20.0,20.0 |
14 |
qc_bpm_lin0_mean |
this |
last_yr |
all
|
H-band linearity coefficient (mean) C0 |
| 3 |
• | QC1DB |
MEDIAN |
7.96578 |
counts |
VAL | -20.0,20.0 |
19 |
qc_bpm_lin0_mean |
this |
last_yr |
all
|
K-band linearity coefficient (mean) C0 |
| 4 |
• | QC1DB |
MEDIAN |
1.41 |
counts |
VAL | -20.0,20.0 |
6 |
qc_bpm_lin0_mean |
this |
last_yr |
all
|
H+K-band linearity coefficient (mean) C0 |
| |
|
*Data sources: QC1DB: QC1 database; LOCAL: local text file
|
General information
Click on any of the plots to see a close-up version.
The latest date is indicated on top of the plot, data points belonging to that date are specially marked.
If configured,
- statistical averages are indicated by a solid line, and thresholds by broken lines
- outliers are marked by a red asterisk. They are defined as data points outside the
threshold lines
- "aliens" (= data points outside the plot Y limits) are marked by a red arrow (↑ or ↓)
- you can download the data for each parameter set if the 'Data downloads' link shows up
|