|
[page auto-refreshes after 300 sec]
[press Ctrl+R to enforce refresh of scores and dates]
| SINFONI trending system: HISTORY plot |
|
Last update: 2010-03-19T15:59:23 (UT)
|
|
|
|
|
*Date on this monitor changes at 21:00 UT |
|

|
|
|
Plot
? |
Symb
? |
Source
* |
Average ? |
Thresholds ? |
N_
data |
QC1
parameter |
Data
downloads |
Remarks |
| method |
value |
unit |
method |
value |
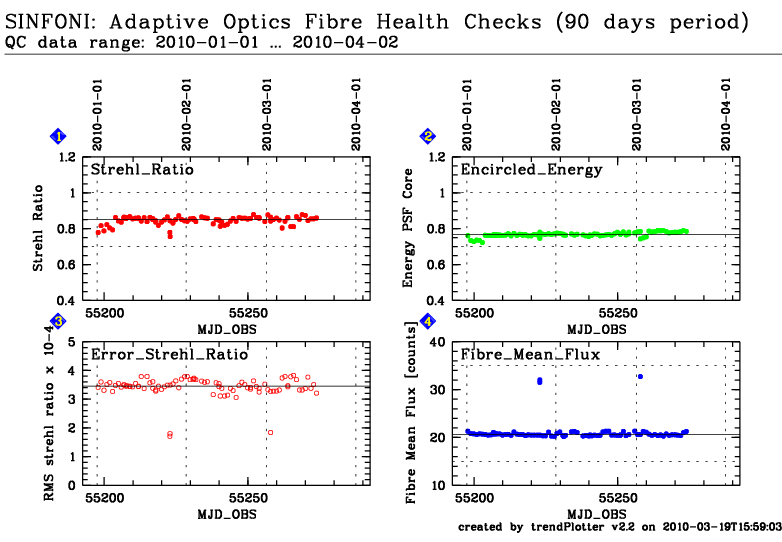
| 1 |
• | QC1DB |
MEDIAN |
0.85158 |
unitless |
VAL | 0.7,1.0 |
90 |
qc_strehl_med |
this |
last_yr |
all
|
median strehl ratio of fibre as computed over full K-band. |
| 2 |
• | QC1DB |
MEDIAN |
0.76675 |
unitless |
VAL | 0.7,1.0 |
90 |
qc_enc_core |
this |
last_yr |
all
|
encircled energy within PSF core (normalized). |
| 3 |
o | QC1DB |
MEDIAN |
3.45 |
unitless x 10-4 |
none | |
90 |
qc_strehl_mederr |
this |
last_yr |
all
|
rms of median strehl ratio of fibre.
(this data set is NOT scored) |
| 4 |
• | QC1DB |
MEDIAN |
20.5691 |
counts |
VAL | 15.,35 |
85 |
qc_frmdif_meanflux |
this |
last_yr |
all
|
average flux level in fibre frame extracted spectrum (counts). |
| |
|
*Data sources: QC1DB: QC1 database; LOCAL: local text file
|
General information
Click on any of the plots to see a close-up version.
The latest date is indicated on top of the plot, data points belonging to that date are specially marked.
If configured,
- statistical averages are indicated by a solid line, and thresholds by broken lines
- outliers are marked by a red asterisk. They are defined as data points outside the
threshold lines
- "aliens" (= data points outside the plot Y limits) are marked by a red arrow (↑ or ↓)
- you can download the data for each parameter set if the 'Data downloads' link shows up
|
|