Plot
? |
Symb
? |
Source
* |
Average ? |
Thresholds ? |
N_
data |
QC1
parameter |
Data
downloads |
Remarks |
| method |
value |
unit |
method |
value |
| 1 |
• | QC1DB |
MEDIAN |
-0.175 |
ADU |
VAL | -2.,2. |
22 |
qc_specflux_coff |
this |
last_yr |
all
|
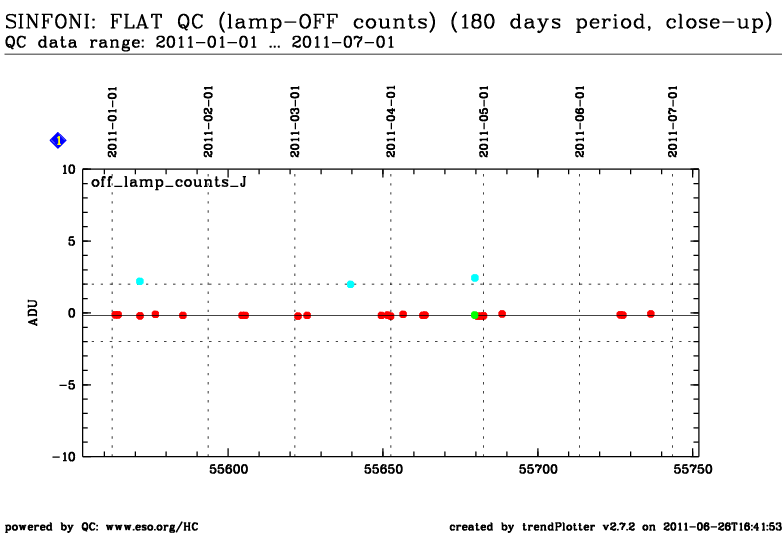
median OFF-lamp counts: J-band/250 mas camera scale
(only this data set is scored) |
| 1 |
• | QC1DB |
none |
|
ADU |
none | |
1 |
qc_specflux_coff |
this |
last_yr |
all
|
median OFF-lamp counts: J-band/100 mas scale |
| 1 |
• | QC1DB |
none |
|
ADU |
none | |
3 |
qc_specflux_coff |
this |
last_yr |
all
|
median OFF-lamp counts: J-band/ 25 mas scale |
|
| 2 |
• | QC1DB |
MEDIAN |
-0.275 |
ADU |
VAL | -2.,2. |
25 |
qc_specflux_coff |
this |
last_yr |
all
|
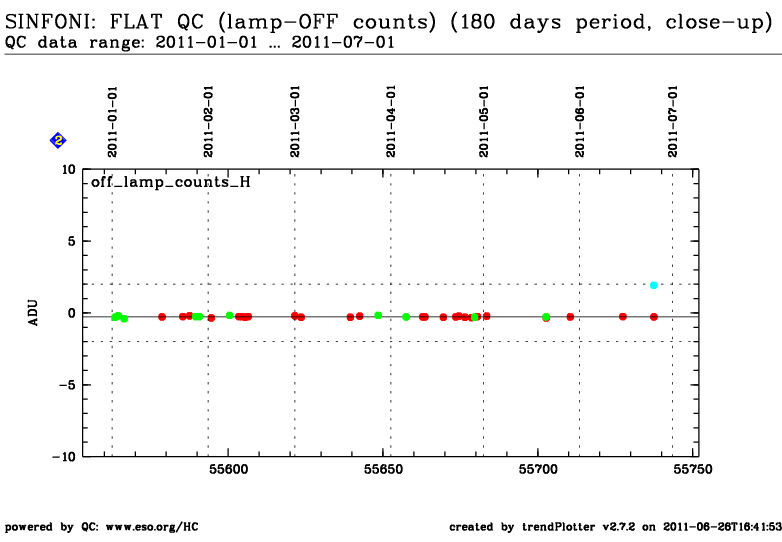
median OFF-lamp counts: H-band/250 mas camera scale
(only this data set is scored) |
| 2 |
• | QC1DB |
none |
|
ADU |
none | |
10 |
qc_specflux_coff |
this |
last_yr |
all
|
median OFF-lamp counts: H-band/100 mas scale |
| 2 |
• | QC1DB |
none |
|
ADU |
none | |
1 |
qc_specflux_coff |
this |
last_yr |
all
|
median OFF-lamp counts: H-band/ 25 mas scale |
|
| 3 |
• | QC1DB |
MEDIAN |
4.175 |
ADU |
VAL | 0.,7. |
41 |
qc_specflux_coff |
this |
last_yr |
all
|
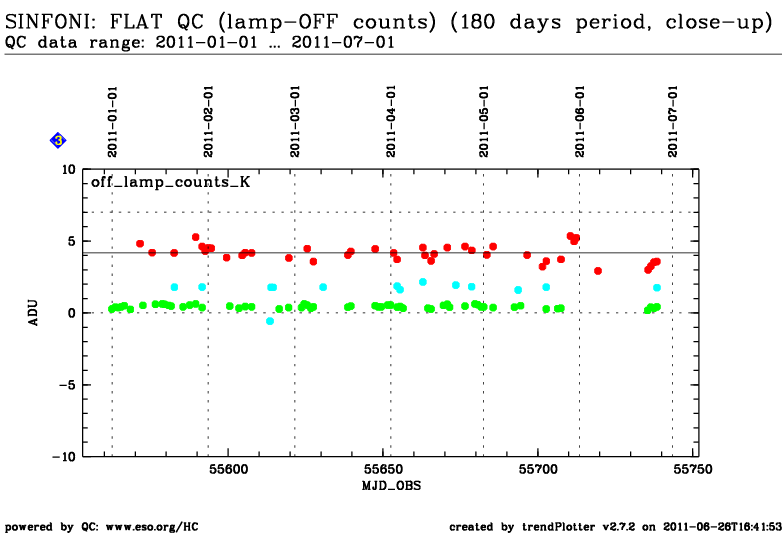
median OFF-lamp counts: K-band/250 mas camera scale
(only this data set is scored) |
| 3 |
• | QC1DB |
none |
|
ADU |
none | |
57 |
qc_specflux_coff |
this |
last_yr |
all
|
median OFF-lamp counts: K-band/100 mas scale |
| 3 |
• | QC1DB |
none |
|
ADU |
none | |
14 |
qc_specflux_coff |
this |
last_yr |
all
|
median OFF-lamp counts: K-band/ 25 mas scale |
|
| 4 |
• | QC1DB |
MEDIAN |
3.4 |
ADU |
VAL | 0.,7. |
44 |
qc_specflux_coff |
this |
last_yr |
all
|
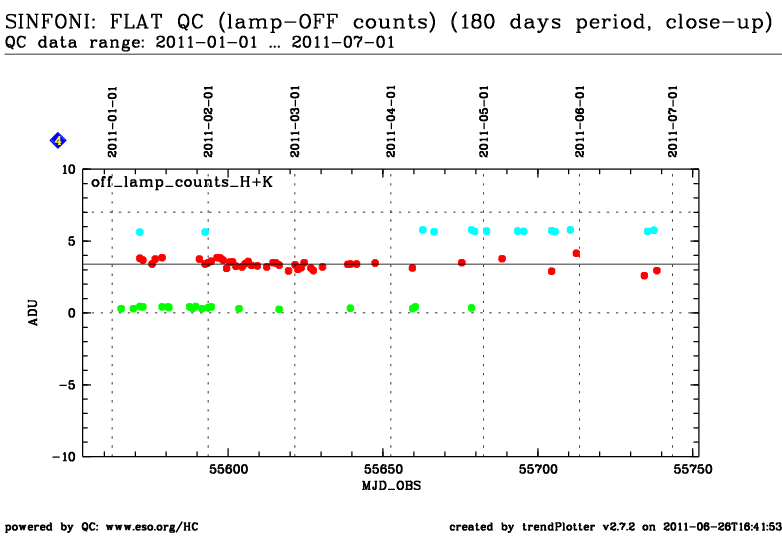
median OFF-lamp counts: H+K-band/250 mas camera scale
(only this data set is scored) |
| 4 |
• | QC1DB |
none |
|
ADU |
none | |
19 |
qc_specflux_coff |
this |
last_yr |
all
|
median OFF-lamp counts: H+K-band/100 mas scale |
| 4 |
• | QC1DB |
none |
|
ADU |
none | |
14 |
qc_specflux_coff |
this |
last_yr |
all
|
median OFF-lamp counts: H+K-band/ 25 mas scale |
|
| |
|
*Data sources: QC1DB: QC1 database; LOCAL: local text file
|
| Plot 1 | | data source: | sinfoni_flat
(QC1 database) |
parameter | dataset:
(numbers applicable to • ) | qc_specflux_coff | • |
| median: | -0.175 | ADU |
| fixed thresholds: | -2.0...2.0 | ADU |
| N_data: | 22 |
| [click on plot for closeup] |
| Plot 2 | | data source: | sinfoni_flat
(QC1 database) |
parameter | dataset:
(numbers applicable to • ) | qc_specflux_coff | • |
| median: | -0.275 | ADU |
| fixed thresholds: | -2.0...2.0 | ADU |
| N_data: | 25 |
| [click on plot for closeup] |
| Plot 3 | | data source: | sinfoni_flat
(QC1 database) |
parameter | dataset:
(numbers applicable to • ) | qc_specflux_coff | • |
| median: | 4.175 | ADU |
| fixed thresholds: | 0.0...7.0 | ADU |
| N_data: | 41 |
| [click on plot for closeup] |
| Plot 4 | | data source: | sinfoni_flat
(QC1 database) |
parameter | dataset:
(numbers applicable to • ) | qc_specflux_coff | • |
| median: | 3.4 | ADU |
| fixed thresholds: | 0.0...7.0 | ADU |
| N_data: | 44 |
| [click on plot for closeup] |
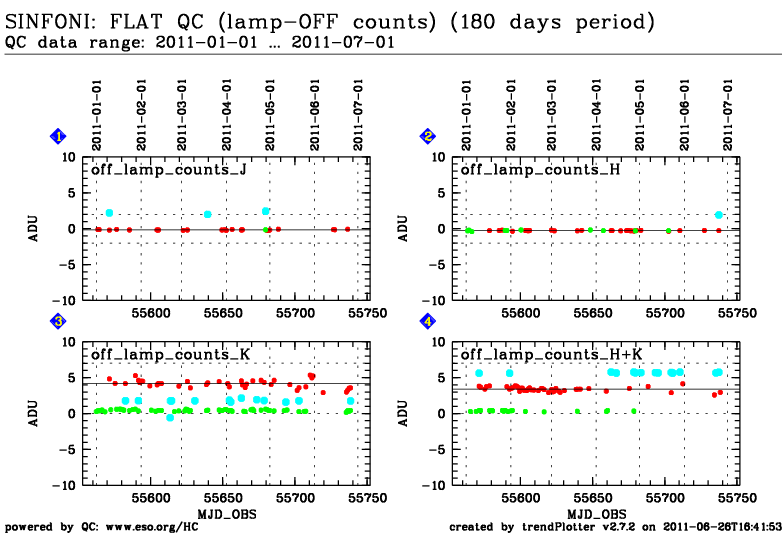
These are the trending plots for the SINFONI QC parameters derived from the LAMP FLATs.
These plots describe:
Day-time FLAT calibrations come in at least five pairs of lamp on/off frames. For each
raw lamp-off frames the corresponding dark frame is subtracted and the median is calculated.
The lamp-off counts are the average of these 5 (or more) values.
1. the median OFF-lamp counts in the J-band for the camera scales: 250, 100, and 25 mas
2. the median OFF-lamp counts in the H-band for the camera scales: 250, 100, and 25 mas
3. the median OFF-lamp counts in the K-band for the camera scales: 250, 100, and 25 mas
4. the median OFF-lamp counts in the H+K-band for the camera scales: 250, 100, and 25 mas
Find more information about SINFONI FLAT frames
here.
Other QC parameters related to detector properties (like contamination,
linearity, gain) are trended
here.
General information
Click on any of the plots to see a close-up version.
The latest date is indicated on top of the plot, data points belonging to that date are specially marked.
If configured,
- statistical averages are indicated by a solid line, and thresholds by broken lines
- outliers are marked by a red asterisk. They are defined as data points outside the
threshold lines
- "aliens" (= data points outside the plot Y limits) are marked by a red arrow (↑ or ↓)
- you can download the data for each parameter set if the 'Data downloads' link shows up
|
