Plot
? |
Symb
? |
Source
* |
Average ? |
Thresholds ? |
N_
data |
QC1
parameter |
Data
downloads |
Remarks |
| method |
value |
unit |
method |
value |
| 1 |
o | QC1DB |
MEDIAN |
0.02078 |
strehl_ratio |
VAL | 0.01,1.0 |
13 |
qc_strehl_med |
this |
last_yr |
all
|
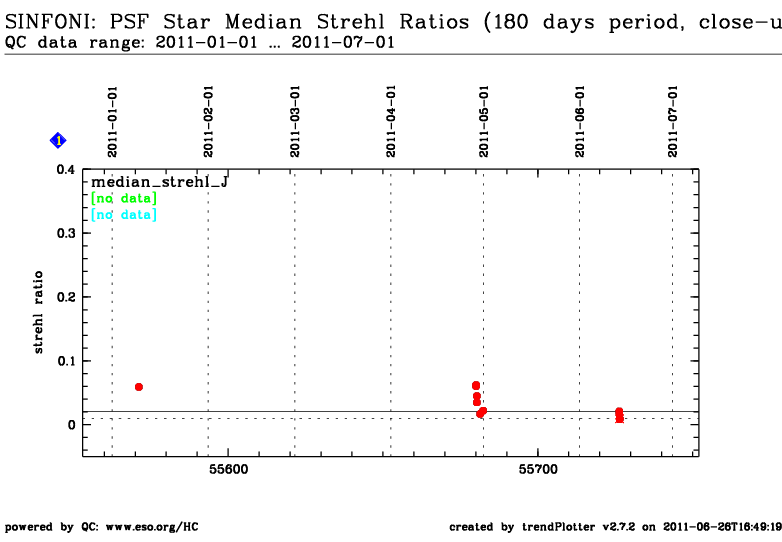
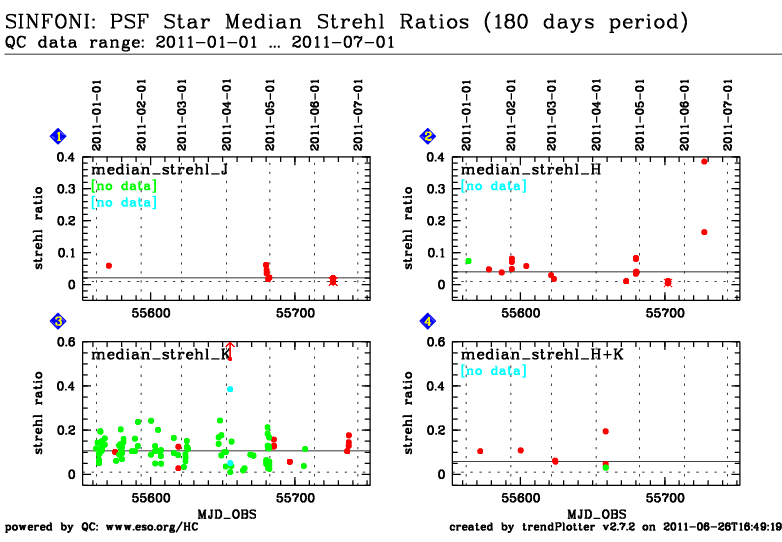
median strehl ratio in the J-band at all camera scales (ADU)
(this FULL data set is scored) |
| 1 |
• | QC1DB |
none |
|
strehl_ratio |
none | |
13 |
qc_strehl_med |
this |
last_yr |
all
|
median strehl ratio: J-band/250 mas scale |
| 1 |
• | QC1DB |
none |
|
strehl_ratio |
none | |
0 |
qc_strehl_med |
this |
last_yr |
all
|
median strehl ratio: J-band/100 mas scale |
| 1 |
• | QC1DB |
none |
|
strehl_ratio |
none | |
0 |
qc_strehl_med |
this |
last_yr |
all
|
median strehl ratio: J-band/25 mas scale |
|
| 2 |
o | QC1DB |
MEDIAN |
0.03982 |
strehl_ratio |
VAL | 0.01,1.0 |
24 |
qc_strehl_med |
this |
last_yr |
all
|
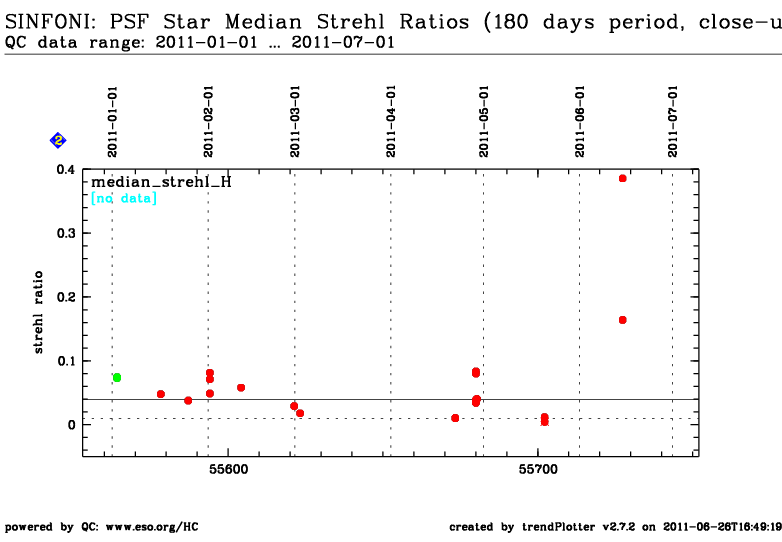
median strehl ratio in the H-band at all camera scales (ADU)
(this FULL data set is scored) |
| 2 |
• | QC1DB |
none |
|
strehl_ratio |
none | |
22 |
qc_strehl_med |
this |
last_yr |
all
|
median strehl ratio: H-band/250 mas scale |
| 2 |
• | QC1DB |
none |
|
strehl_ratio |
none | |
2 |
qc_strehl_med |
this |
last_yr |
all
|
median strehl ratio: H-band/100 mas scale |
| 2 |
• | QC1DB |
none |
|
strehl_ratio |
none | |
0 |
qc_strehl_med |
this |
last_yr |
all
|
median strehl ratio: H-band/25 mas scale |
|
| 3 |
o | QC1DB |
MEDIAN |
0.10572 |
strehl_ratio |
VAL | 0.01,1.0 |
112 |
qc_strehl_med |
this |
last_yr |
all
|
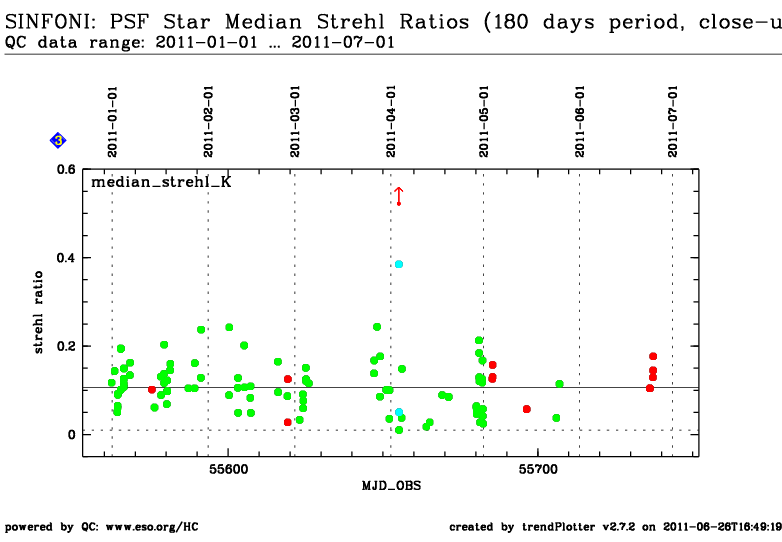
median strehl ratio in the K-band at all camera scales (ADU)
(this FULL data set is scored) |
| 3 |
• | QC1DB |
none |
|
strehl_ratio |
none | |
14 |
qc_strehl_med |
this |
last_yr |
all
|
median strehl ratio: K-band/250 mas scale |
| 3 |
• | QC1DB |
none |
|
strehl_ratio |
none | |
94 |
qc_strehl_med |
this |
last_yr |
all
|
median strehl ratio: K-band/100 mas scale |
| 3 |
• | QC1DB |
none |
|
strehl_ratio |
none | |
4 |
qc_strehl_med |
this |
last_yr |
all
|
median strehl ratio: K-band/25 mas scale |
|
| 4 |
o | QC1DB |
MEDIAN |
0.05811 |
strehl_ratio |
VAL | 0.01,1.0 |
8 |
qc_strehl_med |
this |
last_yr |
all
|
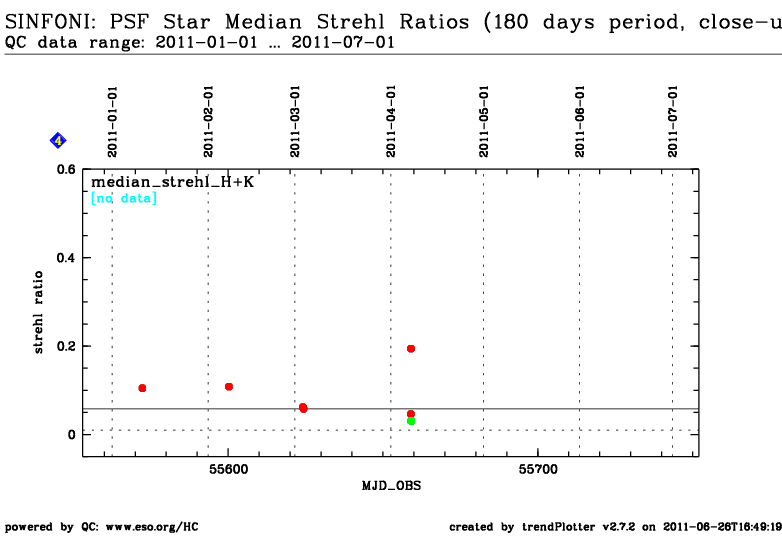
median strehl ratio in the H+K-band at all camera scales (ADU)
(this FULL data set is scored) |
| 4 |
• | QC1DB |
none |
|
strehl_ratio |
none | |
6 |
qc_strehl_med |
this |
last_yr |
all
|
median strehl ratio: H+K-band/250 mas scale |
| 4 |
• | QC1DB |
none |
|
strehl_ratio |
none | |
2 |
qc_strehl_med |
this |
last_yr |
all
|
median strehl ratio: H+K-band/100 mas scale |
| 4 |
• | QC1DB |
none |
|
strehl_ratio |
none | |
0 |
qc_strehl_med |
this |
last_yr |
all
|
median strehl ratio: H+K-band/25 mas scale |
|
| |
|
*Data sources: QC1DB: QC1 database; LOCAL: local text file
|
