Plot
? |
Symb
? |
Source
* |
Average ? |
Thresholds ? |
N_
data |
QC1
parameter |
Data
downloads |
Remarks |
| method |
value |
unit |
method |
value |
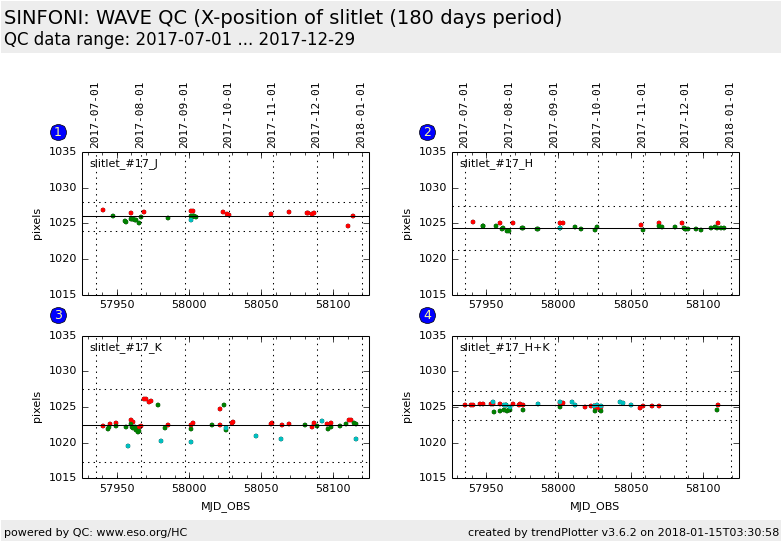
| 1 |
o | QC1DB |
MEDIAN |
1.03e+03 |
pixels |
.2% | ± 2.05 |
33 |
qc_slit17_x |
this |
last_yr |
all
|
X-position of slitlet in J-band at ALL camera scales
(this FULL data set is scored) |
| 1 |
• | QC1DB |
none |
|
pixels |
none | |
16 |
qc_slit17_x |
this |
last_yr |
all
|
X-position of slitlet J-band/250 max scale |
| 1 |
• | QC1DB |
none |
|
pixels |
none | |
16 |
qc_slit17_x |
this |
last_yr |
all
|
X-position of slitlet J-band/100 max scale |
| 1 |
• | QC1DB |
none |
|
pixels |
none | |
1 |
qc_slit17_x |
this |
last_yr |
all
|
X-position of slitlet J-band/25 max scale |
|
| 2 |
o | QC1DB |
MEDIAN |
1.02e+03 |
pixels |
.3% | ± 3.07 |
41 |
qc_slit17_x |
this |
last_yr |
all
|
X-position of slitlet in H-band at ALL camera scales
(this FULL data set is scored) |
| 2 |
• | QC1DB |
none |
|
pixels |
none | |
9 |
qc_slit17_x |
this |
last_yr |
all
|
X-position of slitlet H-band/250 mas scale |
| 2 |
• | QC1DB |
none |
|
pixels |
none | |
31 |
qc_slit17_x |
this |
last_yr |
all
|
X-position of slitlet H-band/100 mas scale |
| 2 |
• | QC1DB |
none |
|
pixels |
none | |
1 |
qc_slit17_x |
this |
last_yr |
all
|
X-position of slitlet H-band/25 mas scale |
|
| 3 |
o | QC1DB |
MEDIAN |
1.02e+03 |
pixels |
.5% | ± 5.11 |
61 |
qc_slit17_x |
this |
last_yr |
all
|
X-position of slitlet in K-band at ALL camera scales
(this FULL data set is scored) |
| 3 |
• | QC1DB |
none |
|
pixels |
none | |
28 |
qc_slit17_x |
this |
last_yr |
all
|
X-position of slitlet K-band/250 mas scale |
| 3 |
• | QC1DB |
none |
|
pixels |
none | |
25 |
qc_slit17_x |
this |
last_yr |
all
|
X-position of slitlet K-band/100 mas scale |
| 3 |
• | QC1DB |
none |
|
pixels |
none | |
8 |
qc_slit17_x |
this |
last_yr |
all
|
X-position of slitlet K-band/25 mas scale |
|
| 4 |
o | QC1DB |
MEDIAN |
1.03e+03 |
pixels |
.2% | ± 2.05 |
52 |
qc_slit17_x |
this |
last_yr |
all
|
X-position of slitlet in H+K-band at ALL camera scales
(this FULL data set is scored) |
| 4 |
• | QC1DB |
none |
|
pixels |
none | |
26 |
qc_slit17_x |
this |
last_yr |
all
|
X-position of slitlet H+K-band/250 mas scale |
| 4 |
• | QC1DB |
none |
|
pixels |
none | |
12 |
qc_slit17_x |
this |
last_yr |
all
|
X-position of slitlet H+K-band/100 mas scale |
| 4 |
• | QC1DB |
none |
|
pixels |
none | |
14 |
qc_slit17_x |
this |
last_yr |
all
|
X-position of slitlet H+K-band/25 mas scale |
| |
|
*Data sources: QC1DB: QC1 database; LOCAL: local data source
|
