Plot
? |
Symb
? |
Source
* |
Average ? |
Thresholds ? |
N_
data |
QC1
parameter |
Data
downloads |
Remarks |
| method |
value |
unit |
method |
value |
| 1 |
• | QC1DB |
none |
|
pixels |
none | |
426 |
qc_xshift_ul |
all (full time range)
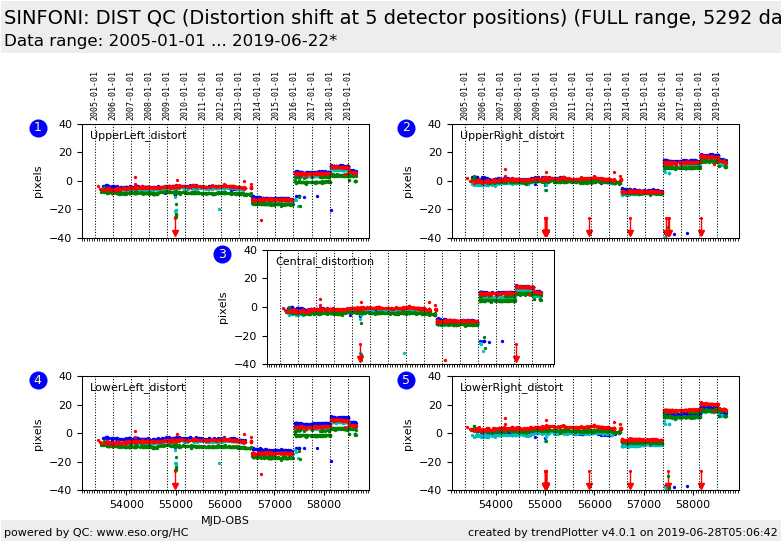
| J-band distortion in center of upper left quadrant of detector [pixels] (25 mas camera scale) |
| 1 |
• | QC1DB |
none |
|
pixels |
none | |
419 |
qc_xshift_ul |
all (full time range)
| H-band distortion in center of upper left quadrant of detector [pixels] (25 mas camera scale) |
| 1 |
• | QC1DB |
none |
|
pixels |
none | |
620 |
qc_xshift_ul |
all (full time range)
| K-band distortion in center of upper left quadrant of detector [pixels] (25 mas camera scale) |
| 1 |
• | QC1DB |
none |
|
pixels |
none | |
621 |
qc_xshift_ul |
all (full time range)
| H+K-band distortion in center of upper left quadrant of detector [pixels] (25 mas camera scale) |
| 2 |
• | QC1DB |
none |
|
pixels |
none | |
426 |
qc_xshift_ur |
all (full time range)
| J-band distortion in center of upper right quadrant of detector [pixels] (25 mas camera scale) |
| 2 |
• | QC1DB |
none |
|
pixels |
none | |
420 |
qc_xshift_ur |
all (full time range)
| H-band distortion in center of upper right quadrant of detector [pixels] (25 mas camera scale) |
| 2 |
• | QC1DB |
none |
|
pixels |
none | |
620 |
qc_xshift_ur |
all (full time range)
| K-band distortion in center of upper right quadrant of detector [pixels] (25 mas camera scale) |
| 2 |
• | QC1DB |
none |
|
pixels |
none | |
621 |
qc_xshift_ur |
all (full time range)
| H+K-band distortion in center of upper right quadrant of detector [pixels] (25 mas camera scale) |
| 3 |
• | QC1DB |
none |
|
pixels |
none | |
426 |
qc_xshift_cc |
all (full time range)
| J-band distortion in center of central quadrant of detector [pixels] (25 mas camera scale) |
| 3 |
• | QC1DB |
none |
|
pixels |
none | |
419 |
qc_xshift_cc |
all (full time range)
| H-band distortion in center of central quadrant of detector [pixels] (25 mas camera scale) |
| 3 |
• | QC1DB |
none |
|
pixels |
none | |
620 |
qc_xshift_cc |
all (full time range)
| K-band distortion in center of central quadrant of detector [pixels] (25 mas camera scale) |
| 3 |
• | QC1DB |
none |
|
pixels |
none | |
621 |
qc_xshift_cc |
all (full time range)
| H+K-band distortion in center of central quadrant of detector [pixels] (25 mas camera scale) |
| 4 |
• | QC1DB |
none |
|
pixels |
none | |
426 |
qc_xshift_ll |
all (full time range)
| J-band distortion in center of lower left quadrant of detector [pixels] (25 mas camera scale) |
| 4 |
• | QC1DB |
none |
|
pixels |
none | |
419 |
qc_xshift_ll |
all (full time range)
| H-band distortion in center of lower left quadrant of detector [pixels] (25 mas camera scale) |
| 4 |
• | QC1DB |
none |
|
pixels |
none | |
620 |
qc_xshift_ll |
all (full time range)
| K-band distortion in center of lower left quadrant of detector [pixels] (25 mas camera scale) |
| 4 |
• | QC1DB |
none |
|
pixels |
none | |
621 |
qc_xshift_ll |
all (full time range)
| H+K-band distortion in center of lower left quadrant of detector [pixels] (25 mas camera scale) |
| 5 |
• | QC1DB |
none |
|
pixels |
none | |
426 |
qc_xshift_lr |
all (full time range)
| J-band distortion in center of lower right quadrant of detector [pixels] (25 mas camera scale) |
| 5 |
• | QC1DB |
none |
|
pixels |
none | |
423 |
qc_xshift_lr |
all (full time range)
| H-band distortion in center of lower right quadrant of detector [pixels] (25 mas camera scale) |
| 5 |
• | QC1DB |
none |
|
pixels |
none | |
622 |
qc_xshift_lr |
all (full time range)
| K-band distortion in center of lower right quadrant of detector [pixels] (25 mas camera scale) |
| 5 |
• | QC1DB |
none |
|
pixels |
none | |
623 |
qc_xshift_lr |
all (full time range)
| H+K-band distortion in center of lower right quadrant of detector [pixels] (25 mas camera scale) |
| |
|
*Data sources: QC1DB: QC1 database; LOCAL: local data source
|
