Plot
? |
Symb
? |
Source
* |
Average ? |
Thresholds ? |
N_
data |
QC1
parameter |
Data
downloads |
Remarks |
| method |
value |
unit |
method |
value |
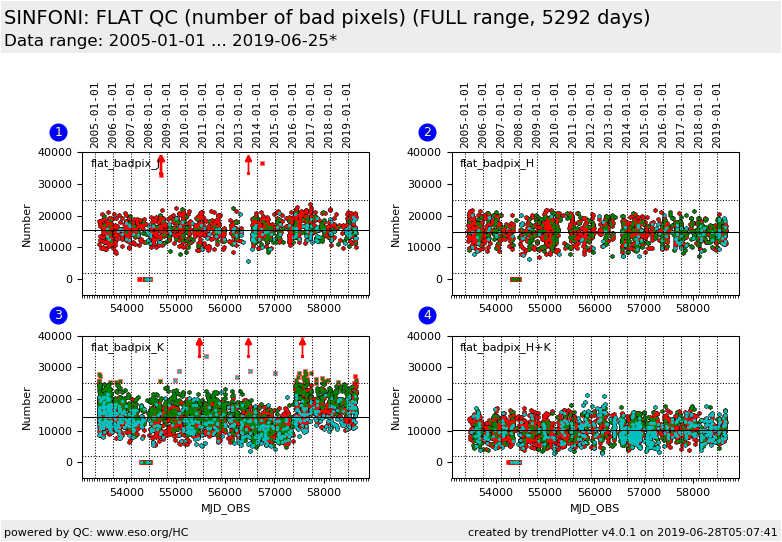
| 1 |
o | QC1DB |
MEDIAN |
1.54e+04 |
Number |
VAL | 2000,25000 |
1308 |
qc_bpm_nbadpix |
all (full time range)
| number of bad pixels in the J-band flat at all camera scales
|
| 1 |
• | QC1DB |
none |
|
Number |
none | |
916 |
qc_bpm_nbadpix |
all (full time range)
| number of bad pixels: J-band/250 mas scale |
| 1 |
• | QC1DB |
none |
|
Number |
none | |
235 |
qc_bpm_nbadpix |
all (full time range)
| number of bad pixels: J-band/100 mas camera scale |
| 1 |
• | QC1DB |
none |
|
Number |
none | |
157 |
qc_bpm_nbadpix |
all (full time range)
| number of bad pixels: J-band/25 mas camera scale |
|
| 2 |
o | QC1DB |
MEDIAN |
1.46e+04 |
Number |
VAL | 2000,25000 |
1370 |
qc_bpm_nbadpix |
all (full time range)
| number of bad pixels in the J-band flat at all camera scales
|
| 2 |
• | QC1DB |
none |
|
Number |
none | |
826 |
qc_bpm_nbadpix |
all (full time range)
| number of bad pixels: H-band/250 mas camera scale |
| 2 |
• | QC1DB |
none |
|
Number |
none | |
436 |
qc_bpm_nbadpix |
all (full time range)
| number of bad pixels: H-band/100 mas camera scale |
| 2 |
• | QC1DB |
none |
|
Number |
none | |
107 |
qc_bpm_nbadpix |
all (full time range)
| number of bad pixels: H-band/25 mas camera scale |
|
| 3 |
o | QC1DB |
MEDIAN |
1.44e+04 |
Number |
VAL | 2000,25000 |
3013 |
qc_bpm_nbadpix |
all (full time range)
| number of bad pixels in the J-band flat at all camera scales
|
| 3 |
• | QC1DB |
none |
|
Number |
none | |
1274 |
qc_bpm_nbadpix |
all (full time range)
| number of bad pixels: K-band/250 mas camera scale |
| 3 |
• | QC1DB |
none |
|
Number |
none | |
1134 |
qc_bpm_nbadpix |
all (full time range)
| number of bad pixels: K-band/100 mas camera scale |
| 3 |
• | QC1DB |
none |
|
Number |
none | |
605 |
qc_bpm_nbadpix |
all (full time range)
| number of bad pixels: K-band/25 mas camera scale |
|
| 4 |
o | QC1DB |
MEDIAN |
1.01e+04 |
Number |
VAL | 2000,25000 |
2184 |
qc_bpm_nbadpix |
all (full time range)
| number of bad pixels in the J-band flat at all camera scales
|
| 4 |
• | QC1DB |
none |
|
Number |
none | |
1053 |
qc_bpm_nbadpix |
all (full time range)
| number of bad pixels: H+K-band/250 mas camera scale |
| 4 |
• | QC1DB |
none |
|
Number |
none | |
540 |
qc_bpm_nbadpix |
all (full time range)
| number of bad pixels: H+K-band/100 mas camera scale |
| 4 |
• | QC1DB |
none |
|
Number |
none | |
591 |
qc_bpm_nbadpix |
all (full time range)
| number of bad pixels: H+K-band/25 mas camera scale |
| |
|
*Data sources: QC1DB: QC1 database; LOCAL: local data source
|
