[page auto-refreshes after 300 sec]   [stop | on]            [press Ctrl+Shift+R to enforce refresh of scores, dates and news]
SINFONI trending system: FULL report
HELP USERS-GUIDE MORE
Last update: 2019-06-28T05:09:13 (UT)
  | now: 2024-05-05T02:17:18 (UT) muc04 QC pipeline: sinfo-3.2.5 (installed 2019-05-09)
close window history: 2009 2010 2011 2012 2013 2014 2015 2016 2017 2018   2019   HEALTH FULL
  ... ... ... ... ... ... ... ... ...
*Date on this monitor changes at 21:00 UT
png: Information and research:
- png file - advanced studies: QC1 browser | QC1 plotter
Plot
?
Symb
?
Source
*
Average ? Thresholds ? N_
data
QC1
parameter
Data
downloads
Remarks
method value unit method value
1 QC1DB MEDIAN 0.577 ADU none  579 qc_rf1 all (full time range) 
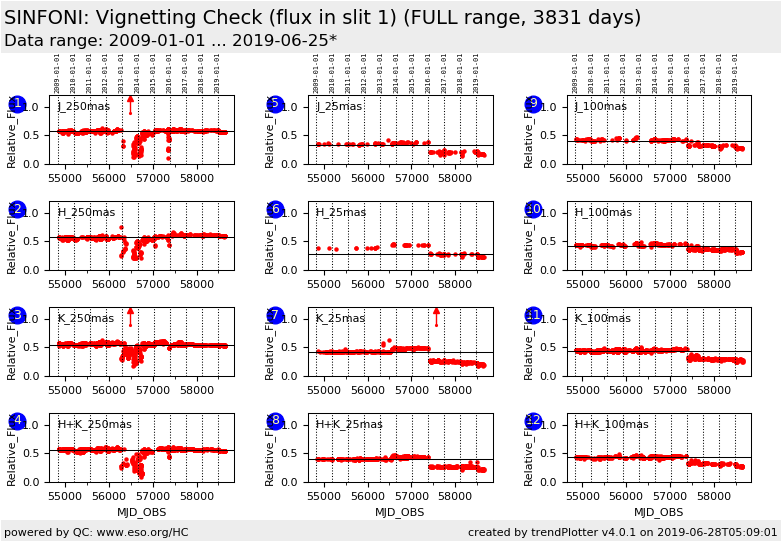
relative flux (slitlet 1): J-band/250 mas scale
2 QC1DB MEDIAN 0.57 ADU none  557 qc_rf1 all (full time range) relative flux (slitlet 1): H-band/250 mas scale
3 QC1DB MEDIAN 0.55 ADU none  901 qc_rf1 all (full time range) relative flux (slitlet 1): K-band at the 250 mas camera scale
4 QC1DB MEDIAN 0.565 ADU none  663 qc_rf1 all (full time range) relative flux (slitlet 1): H+K-band at the 250 mas camera scale

5 QC1DB MEDIAN 0.339 ADU none  121 qc_rf1 all (full time range) relative flux (slitlet 1): J-band/ 25 mas scale
6 QC1DB MEDIAN 0.284 ADU none  82 qc_rf1 all (full time range) relative flux (slitlet 1): H-band/ 25 mas scale
7 QC1DB MEDIAN 0.422 ADU none  365 qc_rf1 all (full time range) relative flux (slitlet 1): K-band at the 25 mas camera scale
8 QC1DB MEDIAN 0.404 ADU none  502 qc_rf1 all (full time range) relative flux (slitlet 1): H+K-band at the 25 mas camera scale

9 QC1DB MEDIAN 0.409 ADU none  196 qc_rf1 all (full time range) relative flux (slitlet 1): J-band/100 mas scale
10 QC1DB MEDIAN 0.415 ADU none  351 qc_rf1 all (full time range) relative flux (slitlet 1): H-band/100 mas scale
11 QC1DB MEDIAN 0.443 ADU none  798 qc_rf1 all (full time range) relative flux (slitlet 1): K-band at the 100 mas camera scale
12 QC1DB MEDIAN 0.431 ADU none  410 qc_rf1 all (full time range) relative flux (slitlet 1): H+K-band at the 100 mas camera scale

*Data sources: QC1DB: QC1 database; LOCAL: local data source
Plot 1
scores: not implemented
data source:sinfoni_flat
(QC1 database)
dataset:qc_rf1
median:0.577ADU
thresholds:none 
N_data plotted:579
[click plot for closeup]
Plot 2
scores: not implemented
data source:sinfoni_flat
(QC1 database)
dataset:qc_rf1
median:0.57ADU
thresholds:none 
N_data plotted:557
[click plot for closeup]
Plot 3
scores: not implemented
data source:sinfoni_flat
(QC1 database)
dataset:qc_rf1
median:0.55ADU
thresholds:none 
N_data plotted:901
[click plot for closeup]
Plot 4
scores: not implemented
data source:sinfoni_flat
(QC1 database)
dataset:qc_rf1
median:0.565ADU
thresholds:none 
N_data plotted:663
[click plot for closeup]
Plot 5
scores: not implemented
data source:sinfoni_flat
(QC1 database)
dataset:qc_rf1
median:0.339ADU
thresholds:none 
N_data plotted:121
[click plot for closeup]
Plot 6
scores: not implemented
data source:sinfoni_flat
(QC1 database)
dataset:qc_rf1
median:0.284ADU
thresholds:none 
N_data plotted:82
[click plot for closeup]
Plot 7
scores: not implemented
data source:sinfoni_flat
(QC1 database)
dataset:qc_rf1
median:0.422ADU
thresholds:none 
N_data plotted:365
[click plot for closeup]
Plot 8
scores: not implemented
data source:sinfoni_flat
(QC1 database)
dataset:qc_rf1
median:0.404ADU
thresholds:none 
N_data plotted:502
[click plot for closeup]
Plot 9
scores: not implemented
data source:sinfoni_flat
(QC1 database)
dataset:qc_rf1
median:0.409ADU
thresholds:none 
N_data plotted:196
[click plot for closeup]
Plot 10
scores: not implemented
data source:sinfoni_flat
(QC1 database)
dataset:qc_rf1
median:0.415ADU
thresholds:none 
N_data plotted:351
[click plot for closeup]
Plot 11
scores: not implemented
data source:sinfoni_flat
(QC1 database)
dataset:qc_rf1
median:0.443ADU
thresholds:none 
N_data plotted:798
[click plot for closeup]
Plot 12
scores: not implemented
data source:sinfoni_flat
(QC1 database)
dataset:qc_rf1
median:0.431ADU
thresholds:none 
N_data plotted:410
[click plot for closeup]
This plot

These are the trending plots for the vignetting check computed from the LAMP FLATs.

Slitlets #1 and #32 correspond to the upper-most and the lower-most slitlets in the field-of-view.
As such, these slitlets can be subject to vignetting to the extent that their overall count rates can be a few 10% lower than for other slitlets. Following image reconstruction, these slitlets are located on the central part of the detector. A possible vignetting is monitored by comparing the relative count rates (i.e. the mean counts in the slitlet #1 or #32 divided by the mean counts in all other slitlets).
This QC1 parameter is most relevant following an instrument intervention.  


General information

Click on any of the plots to see a close-up version.

The latest date is indicated on top of the plot.

If configured,

  • data points belonging to the latest date are specially marked
  • statistical averages are indicated by a solid line, and thresholds by broken lines
  • outliers are marked by a red asterisk. They are defined as data points outside the threshold lines
  • "aliens" (= data points outside the plot Y limits) are marked by a red arrow ( or )
  • you can download the data for each parameter set if the 'Data downloads' link shows up