|
|
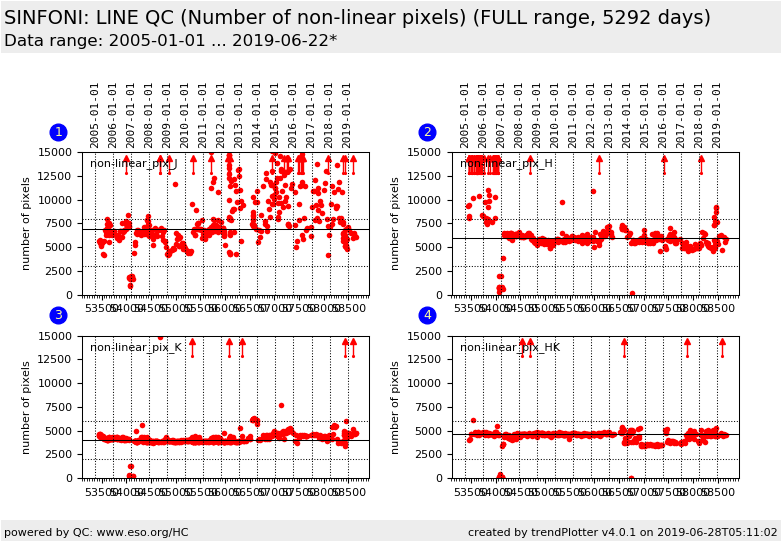
| SINFONI trending system: FULL report |
|
|
| Last update: 2019-06-28T05:11:07 (UT)
|
|
|
|
|
*Date on this monitor changes at 21:00 UT |
|

|
|
|
Plot
? |
Symb
? |
Source
* |
Average ? |
Thresholds ? |
N_
data |
QC1
parameter |
Data
downloads |
Remarks |
| method |
value |
unit |
method |
value |
| 1 |
• | QC1DB |
MEDIAN |
6.95e+03 |
number |
VAL | 3000,8000 |
451 |
qc_bpm_nbadpix |
all (full time range)
| total number of non-linear pixels in the J-band (only for the 25 mas camera scale) |
| 2 |
• | QC1DB |
MEDIAN |
5.99e+03 |
number |
VAL | 3000,8000 |
389 |
qc_bpm_nbadpix |
all (full time range)
| total number of non-linear pixels in the H-band (only for the 25 mas camera scale) |
| 3 |
• | QC1DB |
MEDIAN |
4e+03 |
number |
VAL | 2000,6000 |
534 |
qc_bpm_nbadpix |
all (full time range)
| total number of non-linear pixels in K-band (only for the 25 mas camera scale) |
| 4 |
• | QC1DB |
MEDIAN |
4.61e+03 |
number |
VAL | 2000,6000 |
484 |
qc_bpm_nbadpix |
all (full time range)
| total number of non-linear pixels in the H+K band (only for the 25 mas camera scale) |
| |
|
*Data sources: QC1DB: QC1 database; LOCAL: local data source
|
Plot 1
scores: not implemented
| | data source: | sinfoni_line
(QC1 database) |
| dataset: | qc_bpm_nbadpix | • |
| median: | 6.95e+03 | number |
| fixed thresholds: | 3000...8000 | number |
| N_data plotted: | 451 |
| [click plot for closeup] |
Plot 2
scores: not implemented
| | data source: | sinfoni_line
(QC1 database) |
| dataset: | qc_bpm_nbadpix | • |
| median: | 5.99e+03 | number |
| fixed thresholds: | 3000...8000 | number |
| N_data plotted: | 389 |
| [click plot for closeup] |
Plot 3
scores: not implemented
| | data source: | sinfoni_line
(QC1 database) |
| dataset: | qc_bpm_nbadpix | • |
| median: | 4e+03 | number |
| fixed thresholds: | 2000...6000 | number |
| N_data plotted: | 534 |
| [click plot for closeup] |
Plot 4
scores: not implemented
| | data source: | sinfoni_line
(QC1 database) |
| dataset: | qc_bpm_nbadpix | • |
| median: | 4.61e+03 | number |
| fixed thresholds: | 2000...6000 | number |
| N_data plotted: | 484 |
| [click plot for closeup] |
Click on any of the plots to see a close-up version.
The latest date is indicated on top of the plot.
If configured,
- data points belonging to the latest date are specially marked
- statistical averages are indicated by a solid line, and thresholds by broken lines
- outliers are marked by a red asterisk. They are defined as data points outside the
threshold lines
- "aliens" (= data points outside the plot Y limits) are marked by a red arrow (↑ or ↓)
- you can download the data for each parameter set if the 'Data downloads' link shows up
|