Plot
? |
Symb
? |
Source
* |
Average ? |
Thresholds ? |
N_
data |
QC1
parameter |
Data
downloads |
Remarks |
| method |
value |
unit |
method |
value |
| 1 |
• | QC1DB |
MEDIAN |
1.89e+03 |
unitless |
none | |
1632 |
qc_coef1_med |
all (full time range)
| median resolving power from arc lamp spectral lines (calculated from coef1 and fwhm) in the J-band (250 mas camera scale) |
| 1 |
• | QC1DB |
MEDIAN |
1.95e+03 |
unitless |
none | |
533 |
qc_spec_res_med |
all (full time range)
| median resolving power from arc lamp spectral lines (QC script) in the J-band (250 mas camera scale) |
| 2 |
• | QC1DB |
MEDIAN |
2.56e+03 |
unitless |
none | |
1486 |
qc_coef1_med |
all (full time range)
| median resolving power from arc lamp spectral lines (calculated from coef1 and fwhm) in the H-band (250 mas camera scale) |
| 2 |
• | QC1DB |
MEDIAN |
2.35e+03 |
unitless |
none | |
465 |
qc_spec_res_med |
all (full time range)
| median resolving power from arc lamp spectral lines (QC script) in the H-band (250 mas camera scale) |
| 3 |
• | QC1DB |
MEDIAN |
4.42e+03 |
unitless |
none | |
1922 |
qc_coef1_med |
all (full time range)
| median resolving power from arc lamp spectral lines (calculated from coef1 and fwhm) in the K-band (250 mas camera scale) |
| 3 |
• | QC1DB |
MEDIAN |
4.25e+03 |
unitless |
none | |
797 |
qc_spec_res_med |
all (full time range)
| median resolving power from arc lamp spectral lines (QC script) in the K-band (250 mas camera scale) |
| 4 |
• | QC1DB |
MEDIAN |
1.57e+03 |
unitless |
none | |
1751 |
qc_coef1_med |
all (full time range)
| median resolving power from arc lamp spectral lines (calculated from coef1 and fwhm) in the H+K-band (250 mas camera scale) |
| 4 |
• | QC1DB |
MEDIAN |
1.47e+03 |
unitless |
none | |
596 |
qc_spec_res_med |
all (full time range)
| median resolving power from arc lamp spectral lines (QC script) in the H+K-band (250 mas camera scale) |
| |
|
*Data sources: QC1DB: QC1 database; LOCAL: local data source
|
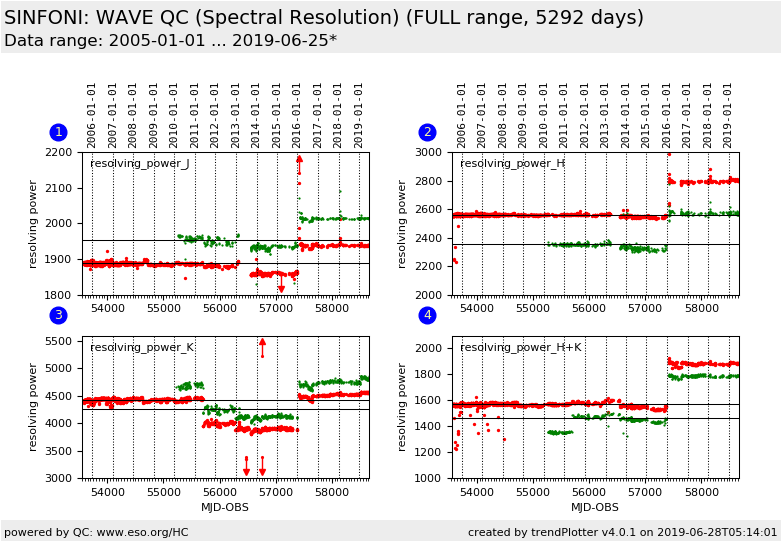
Plot 1
scores: not implemented
| | data source: | sinfoni_wave
(QC1 database) |
dataset:
(numbers below apply to this dataset) | qc_coef1_med | • |
| median: | 1.89e+03 | unitless |
| thresholds: | none | |
| N_data plotted: | 1632 |
| [click plot for closeup] |
Plot 2
scores: not implemented
| | data source: | sinfoni_wave
(QC1 database) |
dataset:
(numbers below apply to this dataset) | qc_coef1_med | • |
| median: | 2.56e+03 | unitless |
| thresholds: | none | |
| N_data plotted: | 1486 |
| [click plot for closeup] |
Plot 3
scores: not implemented
| | data source: | sinfoni_wave
(QC1 database) |
dataset:
(numbers below apply to this dataset) | qc_coef1_med | • |
| median: | 4.42e+03 | unitless |
| thresholds: | none | |
| N_data plotted: | 1922 |
| [click plot for closeup] |
Plot 4
scores: not implemented
| | data source: | sinfoni_wave
(QC1 database) |
dataset:
(numbers below apply to this dataset) | qc_coef1_med | • |
| median: | 1.57e+03 | unitless |
| thresholds: | none | |
| N_data plotted: | 1751 |
| [click plot for closeup] |
red dots: The resolution is calculated as follow (with xdat=fwhm, ydat= qc_coef1_med):
J_0.25 ydat = 1.250/(xdat*abs(ydat))
H_0.25 ydat = 1.650/(xdat*abs(ydat))
K_0.25 ydat = 2.200/(xdat*abs(ydat))
HK_0.25 ydat = 1.950/(xdat*abs(ydat))
green dots: the resolution is calculated using the QC script
General information
Click on any of the plots to see a close-up version.
The latest date is indicated on top of the plot.
If configured,
- data points belonging to the latest date are specially marked
- statistical averages are indicated by a solid line, and thresholds by broken lines
- outliers are marked by a red asterisk. They are defined as data points outside the
threshold lines
- "aliens" (= data points outside the plot Y limits) are marked by a red arrow (↑ or ↓)
- you can download the data for each parameter set if the 'Data downloads' link shows up
|
