Plot
? |
Symb
? |
Source
* |
Average ? |
Thresholds ? |
N_
data |
QC1
parameter |
Data
downloads |
Remarks |
| method |
value |
unit |
method |
value |
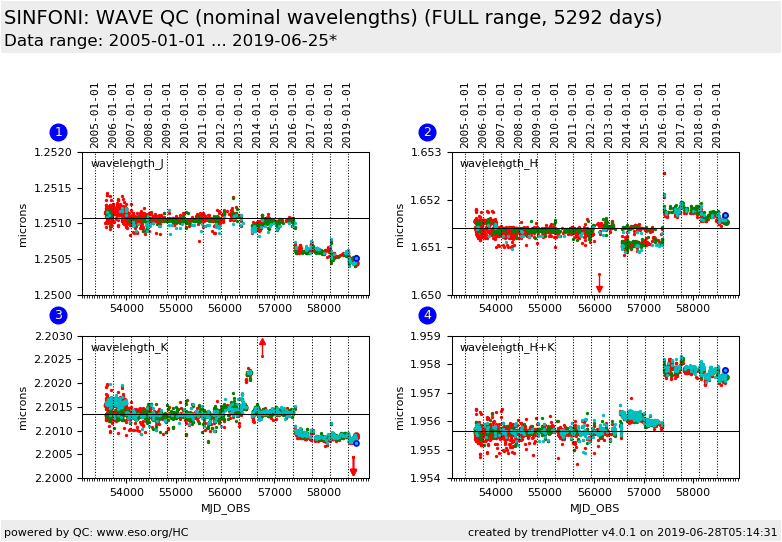
| 1 |
• | QC1DB |
MEDIAN |
1.25 |
microns |
none | |
1630 |
qc_coef0_med |
all (full time range)
| nominal wavelength in the J-band at the 250 mas camera scale |
| 1 |
• | QC1DB |
none |
|
microns |
none | |
231 |
qc_coef0_med |
all (full time range)
| J-band at the 100 mas camera scale |
| 1 |
• | QC1DB |
none |
|
microns |
none | |
145 |
qc_coef0_med |
all (full time range)
| J-band at the 25 mas camera scale |
| 2 |
• | QC1DB |
MEDIAN |
1.65 |
microns |
none | |
1485 |
qc_coef0_med |
all (full time range)
| nominal wavelength in the H-band at the 250 mas camera scale |
| 2 |
• | QC1DB |
none |
|
microns |
none | |
420 |
qc_coef0_med |
all (full time range)
| H-band at the 100 mas camera scale |
| 2 |
• | QC1DB |
none |
|
microns |
none | |
109 |
qc_coef0_med |
all (full time range)
| H-band at the 25 mas camera scale |
| 3 |
• | QC1DB |
MEDIAN |
2.2 |
microns |
none | |
1921 |
qc_coef0_med |
all (full time range)
| nominal wavelength in the K-band at the 250 mas camera scale |
| 3 |
• | QC1DB |
none |
|
microns |
none | |
1038 |
qc_coef0_med |
all (full time range)
| K-band at the 100 mas camera scale |
| 3 |
• | QC1DB |
none |
|
microns |
none | |
528 |
qc_coef0_med |
all (full time range)
| K-band at the 25 mas camera scale |
| 4 |
• | QC1DB |
MEDIAN |
1.96 |
microns |
none | |
1750 |
qc_coef0_med |
all (full time range)
| nominal wavelength in the H+K-band at the 250 mas camera scale |
| 4 |
• | QC1DB |
none |
|
microns |
none | |
528 |
qc_coef0_med |
all (full time range)
| H+K-band at the 100 mas camera scale |
| 4 |
• | QC1DB |
none |
|
microns |
none | |
589 |
qc_coef0_med |
all (full time range)
| H+K-band at the 25 mas camera scale |
| |
|
*Data sources: QC1DB: QC1 database; LOCAL: local data source
|
