Plot
? |
Symb
? |
Source
* |
Average ? |
Thresholds ? |
N_
data |
QC1
parameter |
Data
downloads |
Remarks |
| method |
value |
unit |
method |
value |
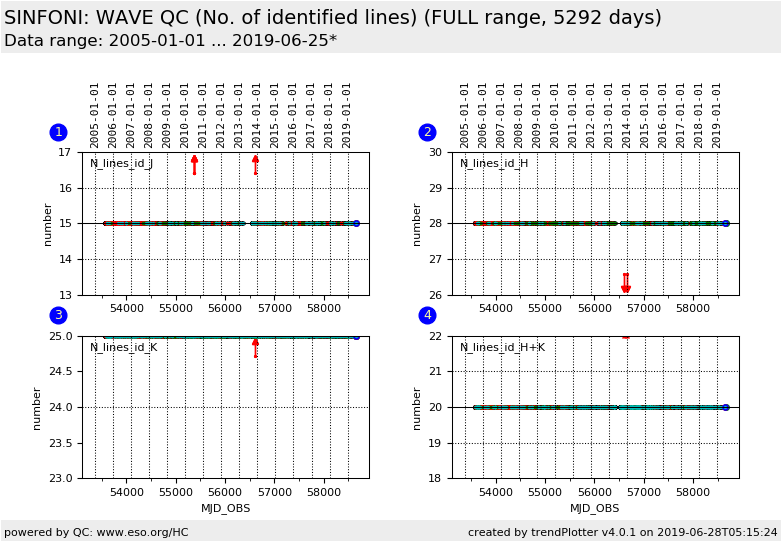
| 1 |
o | QC1DB |
MEDIAN |
15 |
number |
VAL | 14,16 |
2006 |
qc_wave_all |
all (full time range)
| number of identified spectral lines in J-band at ALL camera scales |
| 1 |
• | QC1DB |
none |
|
number |
none | |
1630 |
qc_wave_all |
all (full time range)
| number of identified spectral lines: J-band/250 mas scale |
| 1 |
• | QC1DB |
none |
|
number |
none | |
231 |
qc_wave_all |
all (full time range)
| number of identified spectral lines: J-band/100 mas scale |
| 1 |
• | QC1DB |
none |
|
number |
none | |
145 |
qc_wave_all |
all (full time range)
| number of identified spectral lines: J-band/25 mas scale |
|
| 2 |
o | QC1DB |
MEDIAN |
28 |
number |
VAL | 27,29 |
2014 |
qc_wave_all |
all (full time range)
| number of identified spectral lines in H-band at ALL camera scales |
| 2 |
• | QC1DB |
none |
|
number |
none | |
1485 |
qc_wave_all |
all (full time range)
| number of identified spectral lines: H-band/250 mas scale |
| 2 |
• | QC1DB |
none |
|
number |
none | |
420 |
qc_wave_all |
all (full time range)
| number of identified spectral lines: H-band/100 mas camera scale |
| 2 |
• | QC1DB |
none |
|
number |
none | |
109 |
qc_wave_all |
all (full time range)
| number of identified spectral lines: H-band/25 mas camera scale |
|
| 3 |
o | QC1DB |
MEDIAN |
25 |
number |
VAL | 24,26 |
3487 |
qc_wave_all |
all (full time range)
| number of identified spectral lines in the K-band at ALL camera scales |
| 3 |
• | QC1DB |
none |
|
number |
none | |
1921 |
qc_wave_all |
all (full time range)
| number of identified spectral lines: K-band/250 mas camera scale |
| 3 |
• | QC1DB |
none |
|
number |
none | |
1038 |
qc_wave_all |
all (full time range)
| number of identified spectral lines: K-band/100 mas camera scale |
| 3 |
• | QC1DB |
none |
|
number |
none | |
528 |
qc_wave_all |
all (full time range)
| number of identified spectral lines: K-band/25 mas camera scale |
|
| 4 |
o | QC1DB |
MEDIAN |
20 |
number |
VAL | 19,21 |
2867 |
qc_wave_all |
all (full time range)
| number of identified spectral lines in the H+K-band at ALL camera scales |
| 4 |
• | QC1DB |
none |
|
number |
none | |
1750 |
qc_wave_all |
all (full time range)
| number of identified spectral lines: H+K-band/250 mas camera scale |
| 4 |
• | QC1DB |
none |
|
number |
none | |
528 |
qc_wave_all |
all (full time range)
| number of identified spectral lines: H+K-band/100 mas camera scale |
| 4 |
• | QC1DB |
none |
|
number |
none | |
589 |
qc_wave_all |
all (full time range)
| number of identified spectral lines: H+K-band/25 mas camera scale |
| |
|
*Data sources: QC1DB: QC1 database; LOCAL: local data source
|
