Plot
? |
Symb
? |
Source
* |
Average ? |
Thresholds ? |
N_
data |
QC1
parameter |
Data
downloads |
Remarks |
| method |
value |
unit |
method |
value |
| 1 |
• | QC1DB |
none |
|
ADU |
none | |
998 |
qc_ron |
all (full time range)
| DIT=2, NDIT=40, Nondest |
| 2 |
• | QC1DB |
none |
|
ADU |
none | |
996 |
qc_ron |
all (full time range)
| DIT=8, NDIT=25, Nondest |
| 3 |
• | QC1DB |
none |
|
ADU |
none | |
995 |
qc_ron |
all (full time range)
| DIT=30, NDIT=15, Nondest |
| 4 |
• | QC1DB |
none |
|
NONE |
none | |
37812 |
qc_ron |
all (full time range)
| ron as function of DIT |
| |
|
*Data sources: QC1DB: QC1 database; LOCAL: local data source
|
Plot 1
scores: not implemented
| | data source: | sphere_irdis_dark
(QC1 database) |
| dataset: | qc_ron | • |
| average: | none |
| thresholds: | none |
| N_data plotted: | 998 |
| [click plot for closeup] |
Plot 2
scores: not implemented
| | data source: | sphere_irdis_dark
(QC1 database) |
| dataset: | qc_ron | • |
| average: | none |
| thresholds: | none |
| N_data plotted: | 996 |
| [click plot for closeup] |
Plot 3
scores: not implemented
| | data source: | sphere_irdis_dark
(QC1 database) |
| dataset: | qc_ron | • |
| average: | none |
| thresholds: | none |
| N_data plotted: | 995 |
| [click plot for closeup] |
Plot 4
scores: not implemented
| | data source: | sphere_irdis_dark
(QC1 database) |
| dataset: | qc_ron | • |
| average: | none |
| thresholds: | none |
| N_data plotted: | 37812 |
| [click plot for closeup] |
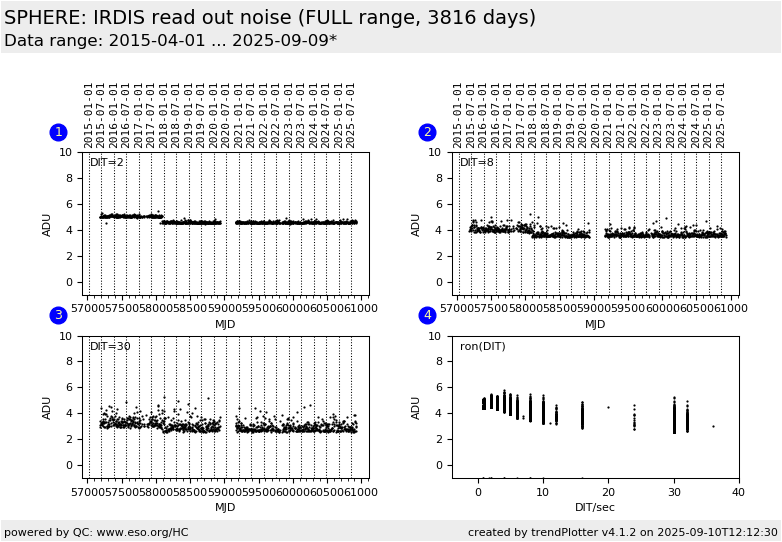
This plot shows the IRDIS readout noise (RON) values extracted from from dark exposures of the three regularly acquired
setups
- DIT=2, NDIT=40
- DIT=8, NDIT=25
- DIT=30, NDIT=15
RON values are extracted by a QC script in the same manner as for IFS darks.
General information
Click on any of the plots to see a close-up version.
The latest date is indicated on top of the plot.
If configured,
- data points belonging to the latest date are specially marked
- statistical averages are indicated by a solid line, and thresholds by broken lines
- outliers are marked by a red asterisk. They are defined as data points outside the
threshold lines
- "aliens" (= data points outside the plot Y limits) are marked by a red arrow (↑ or ↓)
- you can download the data for each parameter set if the 'Data downloads' link shows up
|
