Plot
? |
Symb
? |
Source
* |
Average ? |
Thresholds ? |
N_
data |
QC1
parameter |
Data
downloads |
Remarks |
| method |
value |
unit |
method |
value |
| 1 |
• | QC1DB |
MEDIAN |
10127.9 |
ADU |
VAL | 5000,50000 |
687 |
qc_iframe_raw_med |
all (full time range)
| counts in V imaging flats, CAM1 |
| 2 |
• | QC1DB |
MEDIAN |
11836.6 |
ADU |
VAL | 5000,55000 |
1062 |
qc_iframe_raw_med |
all (full time range)
| counts in R imaging flats, CAM1 |
| 3 |
• | QC1DB |
MEDIAN |
23210 |
ADU |
VAL | 5000,55000 |
670 |
qc_iframe_raw_med |
all (full time range)
| counts in I imaging flats, CAM1 |
| 4 |
• | QC1DB |
MEDIAN |
11507.2 |
ADU |
VAL | 5000,55000 |
687 |
qc_iframe_raw_med |
all (full time range)
| counts in V imaging flats, CAM2 |
| 5 |
• | QC1DB |
MEDIAN |
14112.9 |
ADU |
VAL | 5000,55000 |
1063 |
qc_iframe_raw_med |
all (full time range)
| counts in R imaging flats, CAM2 |
| 6 |
• | QC1DB |
MEDIAN |
27269.3 |
ADU |
VAL | 5000,55000 |
670 |
qc_iframe_raw_med |
all (full time range)
| counts in I imaging flats, CAM2 |
| |
|
*Data sources: QC1DB: QC1 database; LOCAL: local data source
|
Plot 1
scores: not implemented
| | data source: | sphere_zimpol_iflat_img
(QC1 database) |
| dataset: | qc_iframe_raw_med | • |
| median: | 10127.9 | ADU |
| fixed thresholds: | 5000...50000 | ADU |
| N_data plotted: | 687 |
| [click plot for closeup] |
Plot 2
scores: not implemented
| | data source: | sphere_zimpol_iflat_img
(QC1 database) |
| dataset: | qc_iframe_raw_med | • |
| median: | 11836.6 | ADU |
| fixed thresholds: | 5000...55000 | ADU |
| N_data plotted: | 1062 |
| [click plot for closeup] |
Plot 3
scores: not implemented
| | data source: | sphere_zimpol_iflat_img
(QC1 database) |
| dataset: | qc_iframe_raw_med | • |
| median: | 23210 | ADU |
| fixed thresholds: | 5000...55000 | ADU |
| N_data plotted: | 670 |
| [click plot for closeup] |
Plot 4
scores: not implemented
| | data source: | sphere_zimpol_iflat_img
(QC1 database) |
| dataset: | qc_iframe_raw_med | • |
| median: | 11507.2 | ADU |
| fixed thresholds: | 5000...55000 | ADU |
| N_data plotted: | 687 |
| [click plot for closeup] |
Plot 5
scores: not implemented
| | data source: | sphere_zimpol_iflat_img
(QC1 database) |
| dataset: | qc_iframe_raw_med | • |
| median: | 14112.9 | ADU |
| fixed thresholds: | 5000...55000 | ADU |
| N_data plotted: | 1063 |
| [click plot for closeup] |
Plot 6
scores: not implemented
| | data source: | sphere_zimpol_iflat_img
(QC1 database) |
| dataset: | qc_iframe_raw_med | • |
| median: | 27269.3 | ADU |
| fixed thresholds: | 5000...55000 | ADU |
| N_data plotted: | 670 |
| [click plot for closeup] |
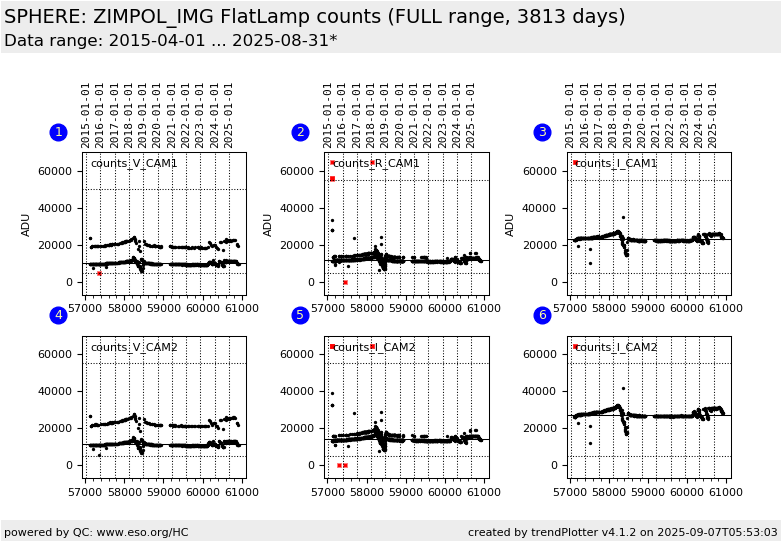
This plot monitors the counts generated by the halogen lamp in ZIMPOL imaging flats. (A lamp flux in ADU/sec is not provided by the pipeline).
The following setups are monitored:
- V filter, DIT, NDIT = 4.0, 10 and 8.0, 8
- N_R filter, DIT, NDIT = 2.0, 20 and 2.0, 8
- N_I filter, DIT, NDIT = 2.0, 40 and 2.0, 8
General information
Click on any of the plots to see a close-up version.
The latest date is indicated on top of the plot.
If configured,
- data points belonging to the latest date are specially marked
- statistical averages are indicated by a solid line, and thresholds by broken lines
- outliers are marked by a red asterisk. They are defined as data points outside the
threshold lines
- "aliens" (= data points outside the plot Y limits) are marked by a red arrow (↑ or ↓)
- you can download the data for each parameter set if the 'Data downloads' link shows up
|
